Xponent’s performance dashboard capability leverages all of your data, analyzes it, and visualizes it to impact business decisions and drive change . You can access the performance dashboard(s) under the Analytics section of Journey Hub once enabled.

Performance Dashboards provide Also provides a custom view into of project goals and KPI’sKPIs.
...
This is designed to provide your team and stakeholders with a view of how your journeys are performing and can show breakdowns show breakdowns into critical segments and comparisons of various journeys as needed, allows allowing you to answer key business questions about churn rate, drop-off percentages, etc.
The xponent performance dashboard gives you the ability to mix mix and match the building blocks you will need to present ad-hoc analysis and is tied , and it is tied to your analytics database (Redshift) to provide near real-time data.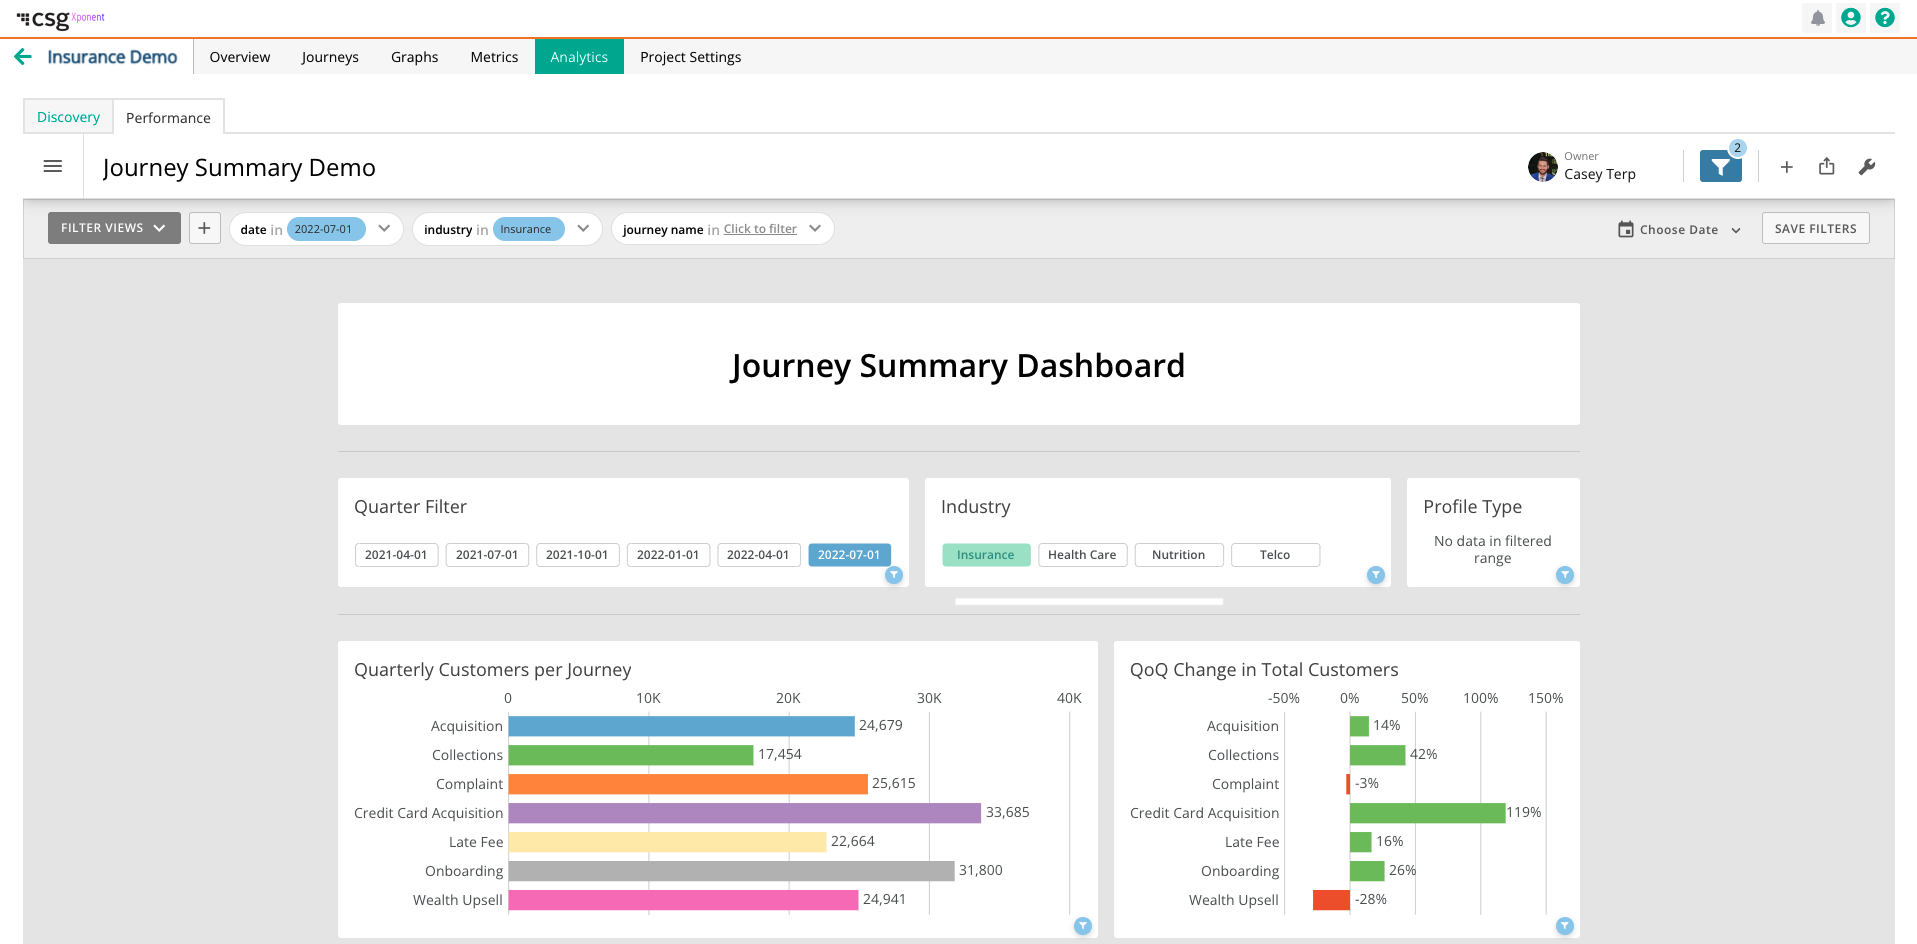
...
Once integrated, the dashboard will show up under the "Analytics" tab under "Performance", giving you an immediate look into how your journeys are performing , and equipping you with the necessary information before you start optimizing your journey orchestration.
| Info |
|---|
To set up the performance dashboard, please contact your CSG Customer Success Team to integrate the performance dashboard into your project. |
| Child pages (Children Display) |
|---|