Twitter - Cats 'n' Dogs
- Atul Dattatray Bhujbal
- Neil Skilling (Deactivated)
This page describes is a worked example that can be used on conjunction with the 00 Introduction to Xponent training slides.
Goal
This provides a set of instructions that a trainer (or trainee) can follow to create an initial customer journey and a working Twitter process. With all steps from start to finish documented to create the process, this will give you a repeatable process to build and learn from.
Prerequisites
You will need to log in to the Xponent hub, and have a basic overview of the functionality on the home page.
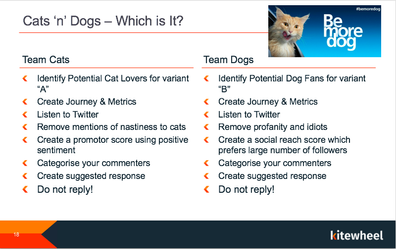
This picks up from the example on page 18. You could do this, or if the group is smaller, you could have people create a listener that picks up cats and dogs, segments them, and has metrics on each branch to it has a self contained 'over 1000 tweets, 510 were cats and 490 were dogs'.
Ingredients
For this example you will need
- A project
- A journey map
- 'Some' metrics
- A twitter account
- A twitter connector
- A twitter adaptor
- A new section of schema
- A database connection
- A database adaptor
- A graph to pull the process together
It would be helpful to have access to the database via MySQL WorkBench, or similar client tool for troubleshooting and database table and schema checking.
Step 1 - Project Creation and Setup
The idea of the worked example is to create a Twitter process you can use to identify people that show an interest in Cats or Dogs, that you can then potentially sell things to. This might be pet insurance, pet food, or any pet related products. Twitter, whilst mostly rubbish, can be used as a good lead generation tool, identifying influences or handraisers. In this example, it is a good, readily available data set to test decisions against.
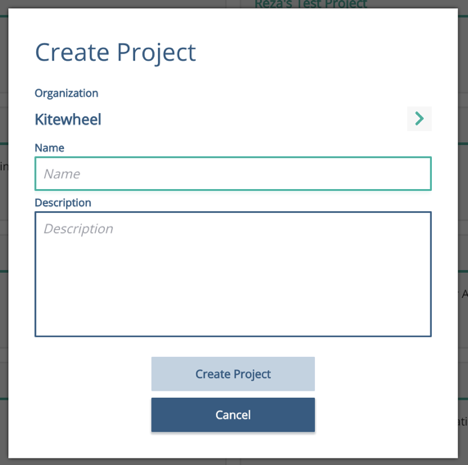
Having logged in, you should be on the projects home page. If you haven't already, create yourself a project by clicking on the plus sign icon, top left hand side in the middle of the K. Give it a name and a description.
Click on the Journey map icon on the bottom left of your new project to create a new journey. Select the 'Blank' Jump Start / Journey, and give this a name "Cat Handraisers" or similar, and click on the 'Create New Item' big button at the bottom of the screen. This will give you a nearly blank canvas in which to create your journey map.
The Journey Map allows you to create a top level journey that you want to take your potential customers on. You also associate metrics at this level, so you can gauge the success of the journeys you create.
02 Journey Mapper slides
In this case, you might be looking for leads on Twitter for people that tweet about either cats or dogs, and then put them into 3 segments for follow up. Instructions on using the Journey Mapper are found here.
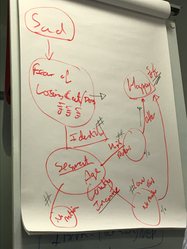
Your journey map might look something like this.
Once you have your Journey in place, we can start putting the process in place.
Step 2 - Setting up the Twitter Connection
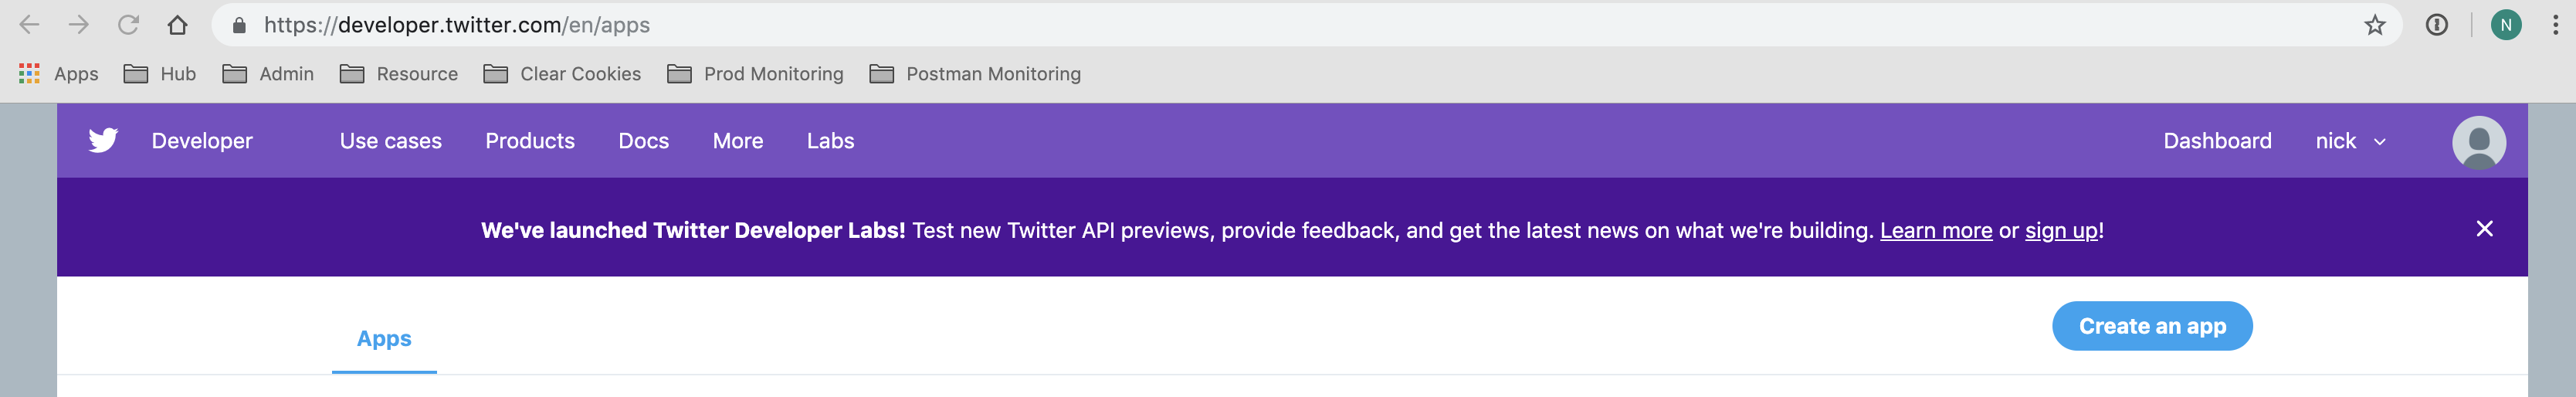
You will need a Twitter account, and the access keys to this. Browse to https://developer.twitter.com and sign into your account. Hit 'Create New App' top right to create a new app for the account.
This will need a name and a description. Under the website, put a pull URL, such as http://www.Xponent.com
Create your twitter application, and click the 'Keys and Access Tokens' tab. You will need
- Consumer Key (API Key)
- Consumer Secret (API Secret)
- Access Token
- Access Token Secret
Having created these, go back to Xponent and create a connection to Twitter using these elements.
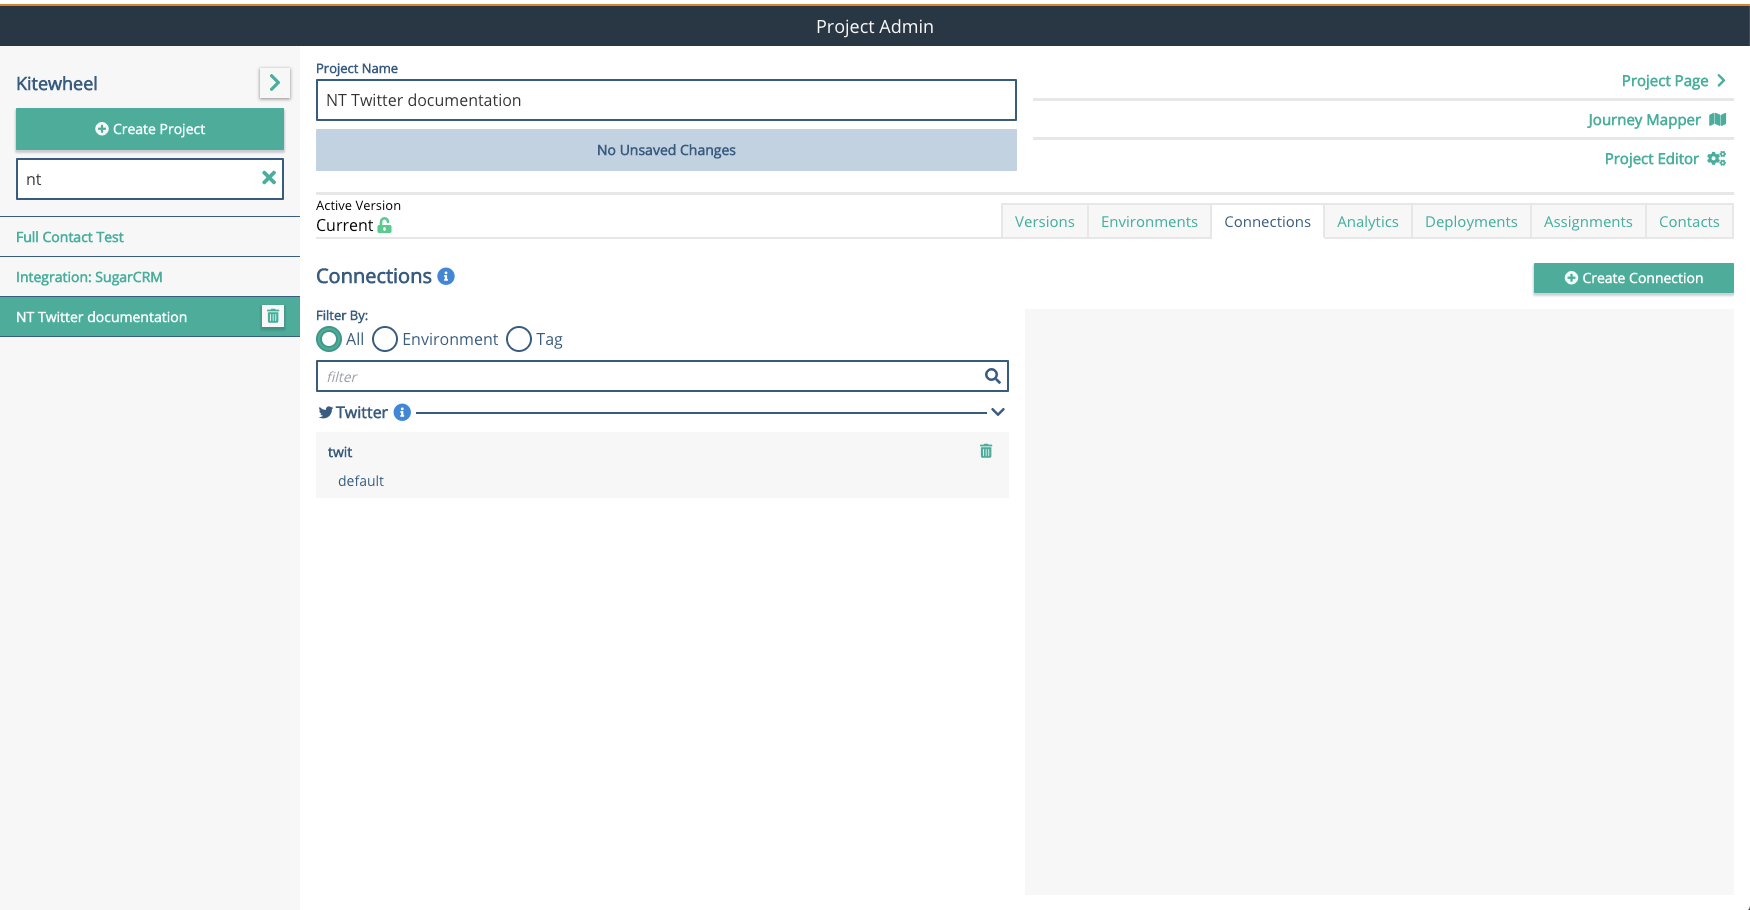
From your Journey Map, click the Admin button, top right, to get to the Admin screen to create a new connection.
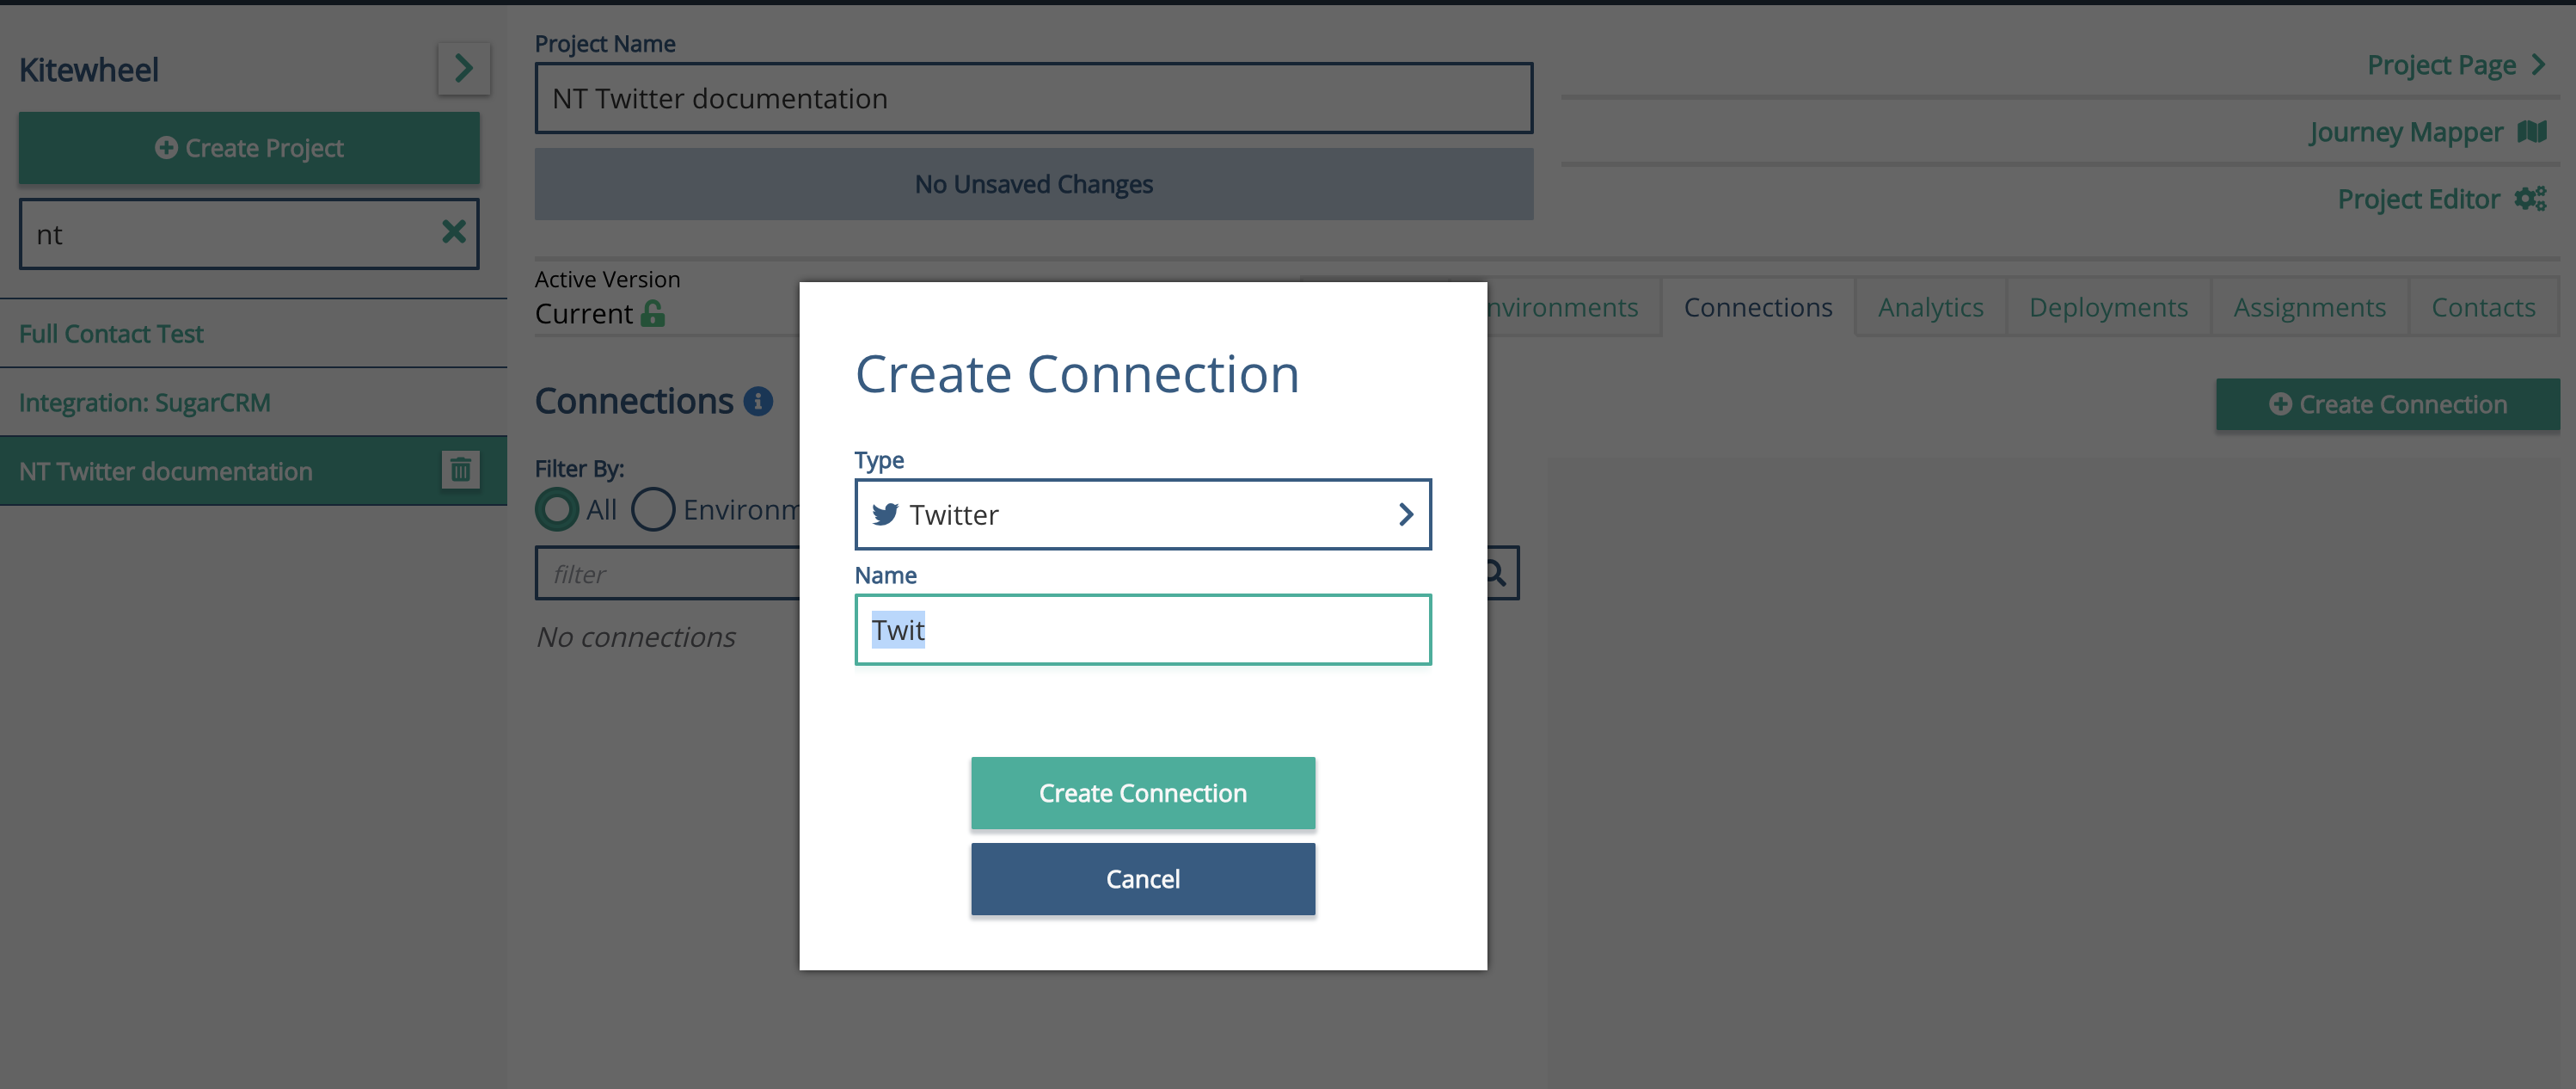
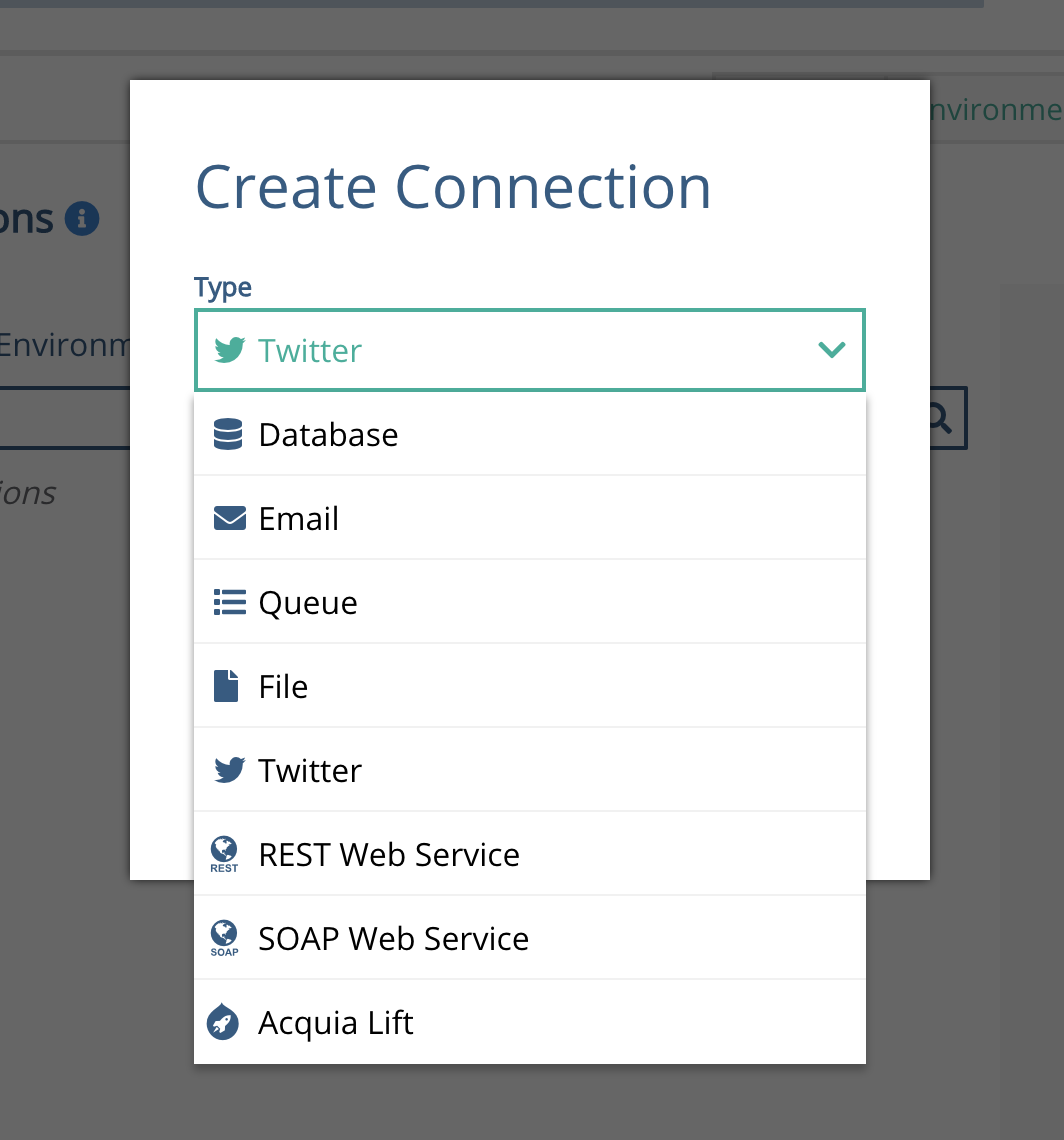
Add a new connection, and select Twitter
You will need to give this connection a name - the suggestion here is to make the name relevant to the Twitter Account you are using.
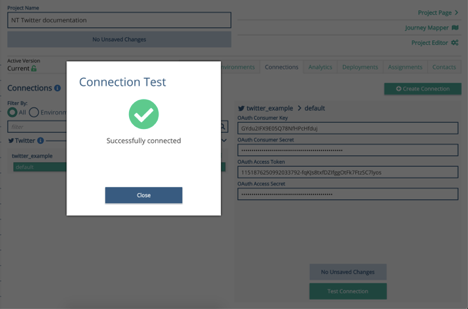
For your default environment, you will need to cut and paste the API keys you recently created in your twitter app.
Paste these in, SAVE the connector, and Test it. This should test successfully. If not, check the keys you have copied from the Twitter App page, as these sometimes do not copy correctly.
Now you have a connector, you can create the adaptor that will use the connector to access Twitter and select tweets from the Twitter stream that match your requirements.
Connectors have the connection details to the web service API, database, Twitter, Email provider etc. These give you access to the 'thing'. Once you have connected, the Adaptor uses this to do something with the 'thing'. In this case, we have a Twitter connector that gives access to the account, but as we are just listening, we can do this directly in a graph.
Step 3 - Create the Project
Click the 'Project Editor' button top right to get to the project editor page.
From the drop down, top right, select + Create New
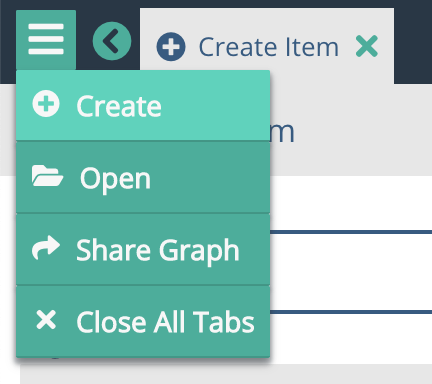
Create a new Blank Graph, with an appropriate name.
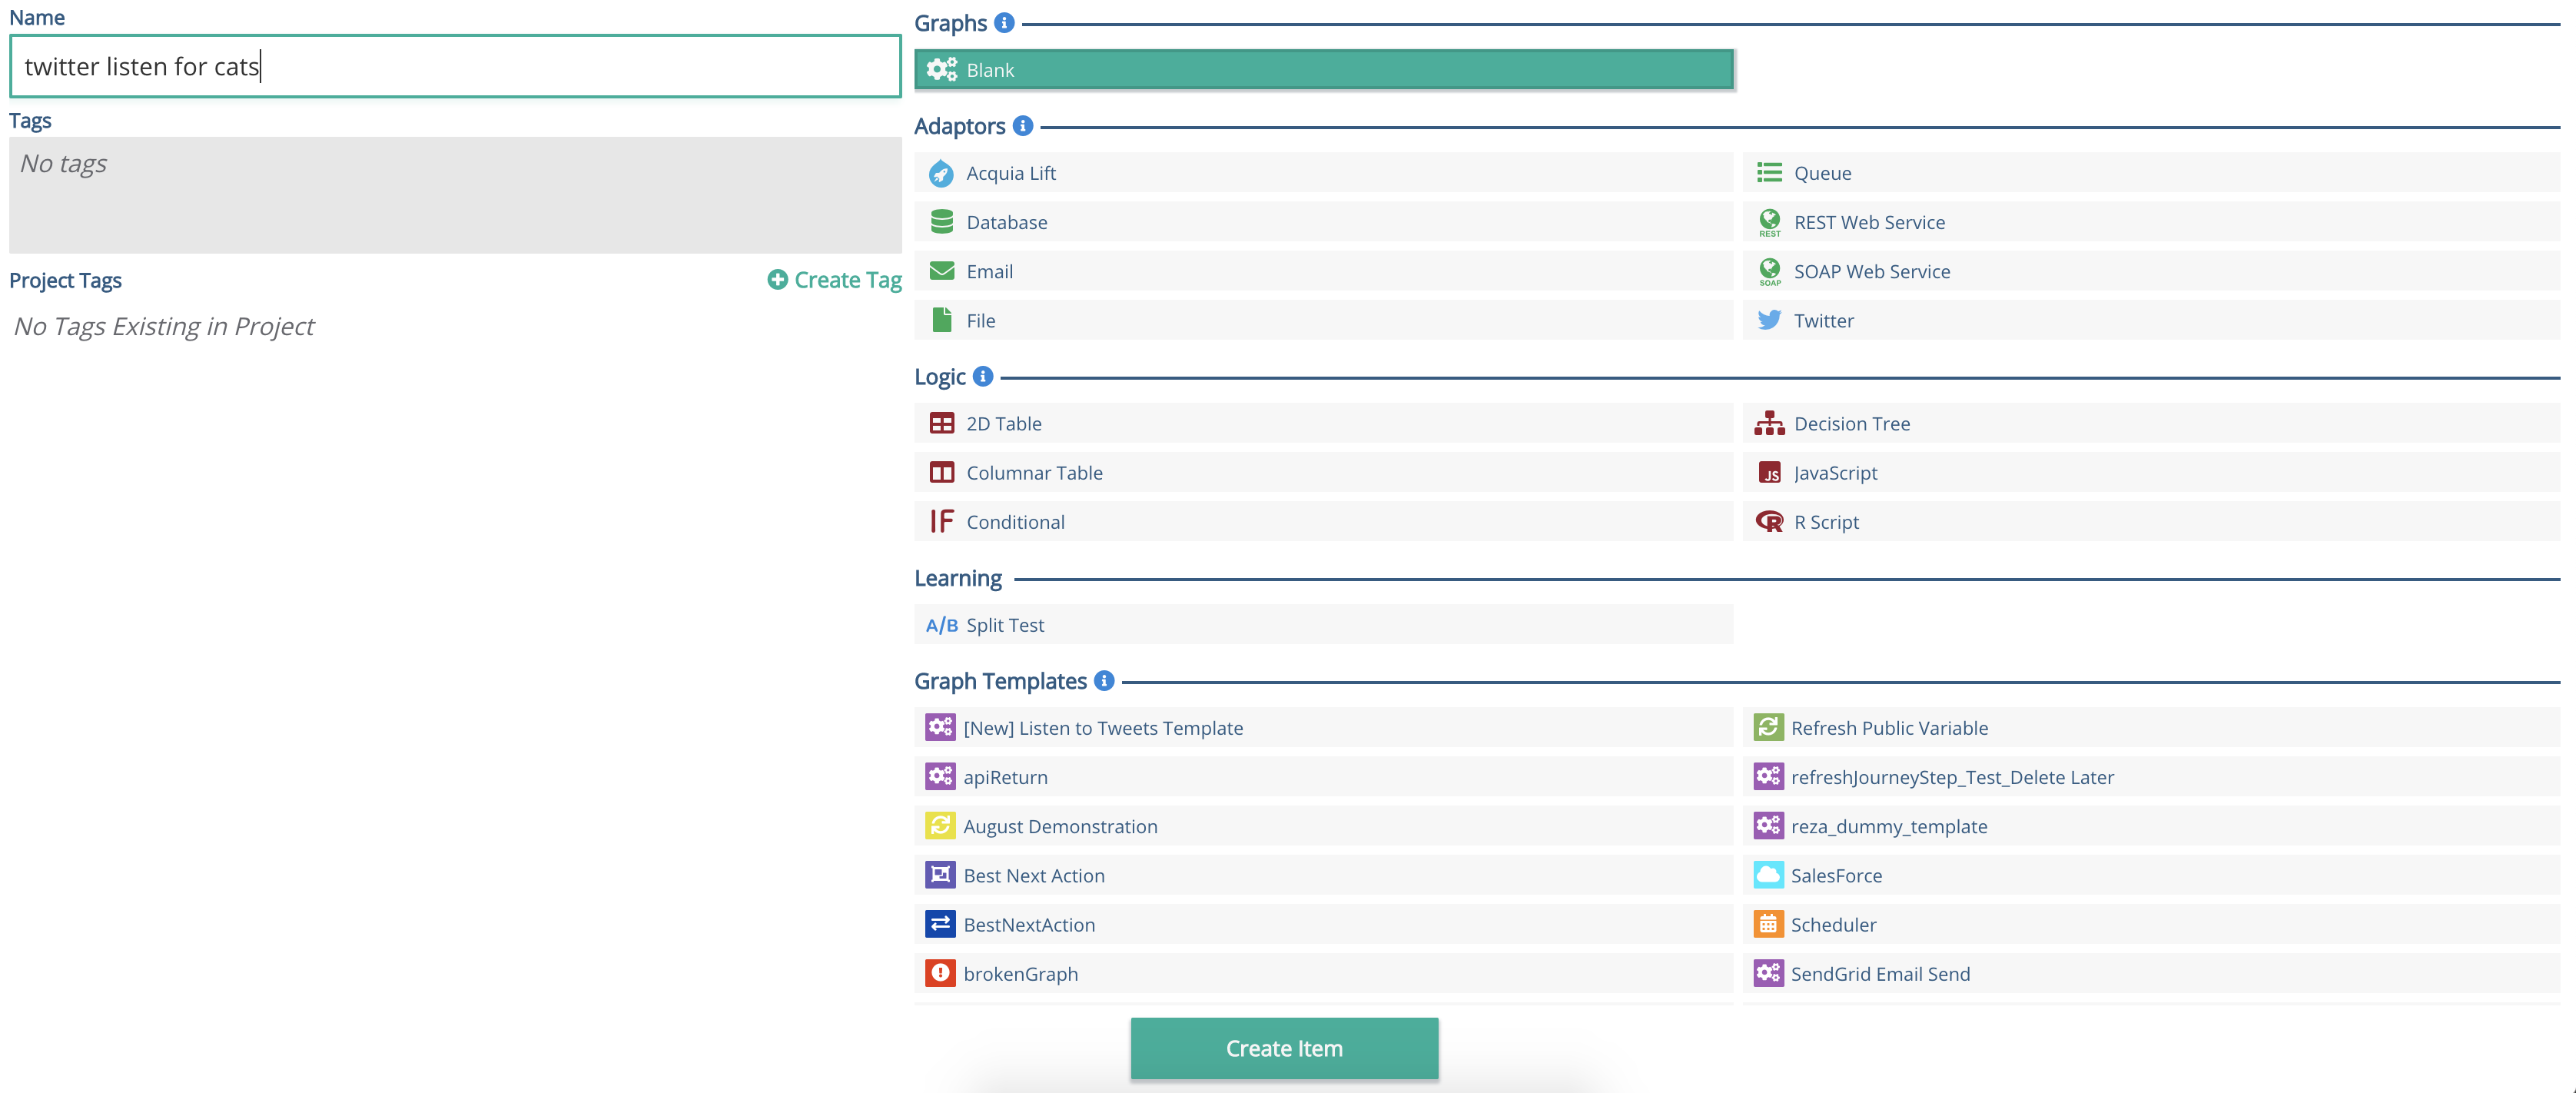
To create the item, click the button at the bottom of the screen.
Now you have a blank graph. More info on creating these can be found here.
For this element of the example, we are initially going to create a simple graph, add a listener to it, then expand the graph as we go.
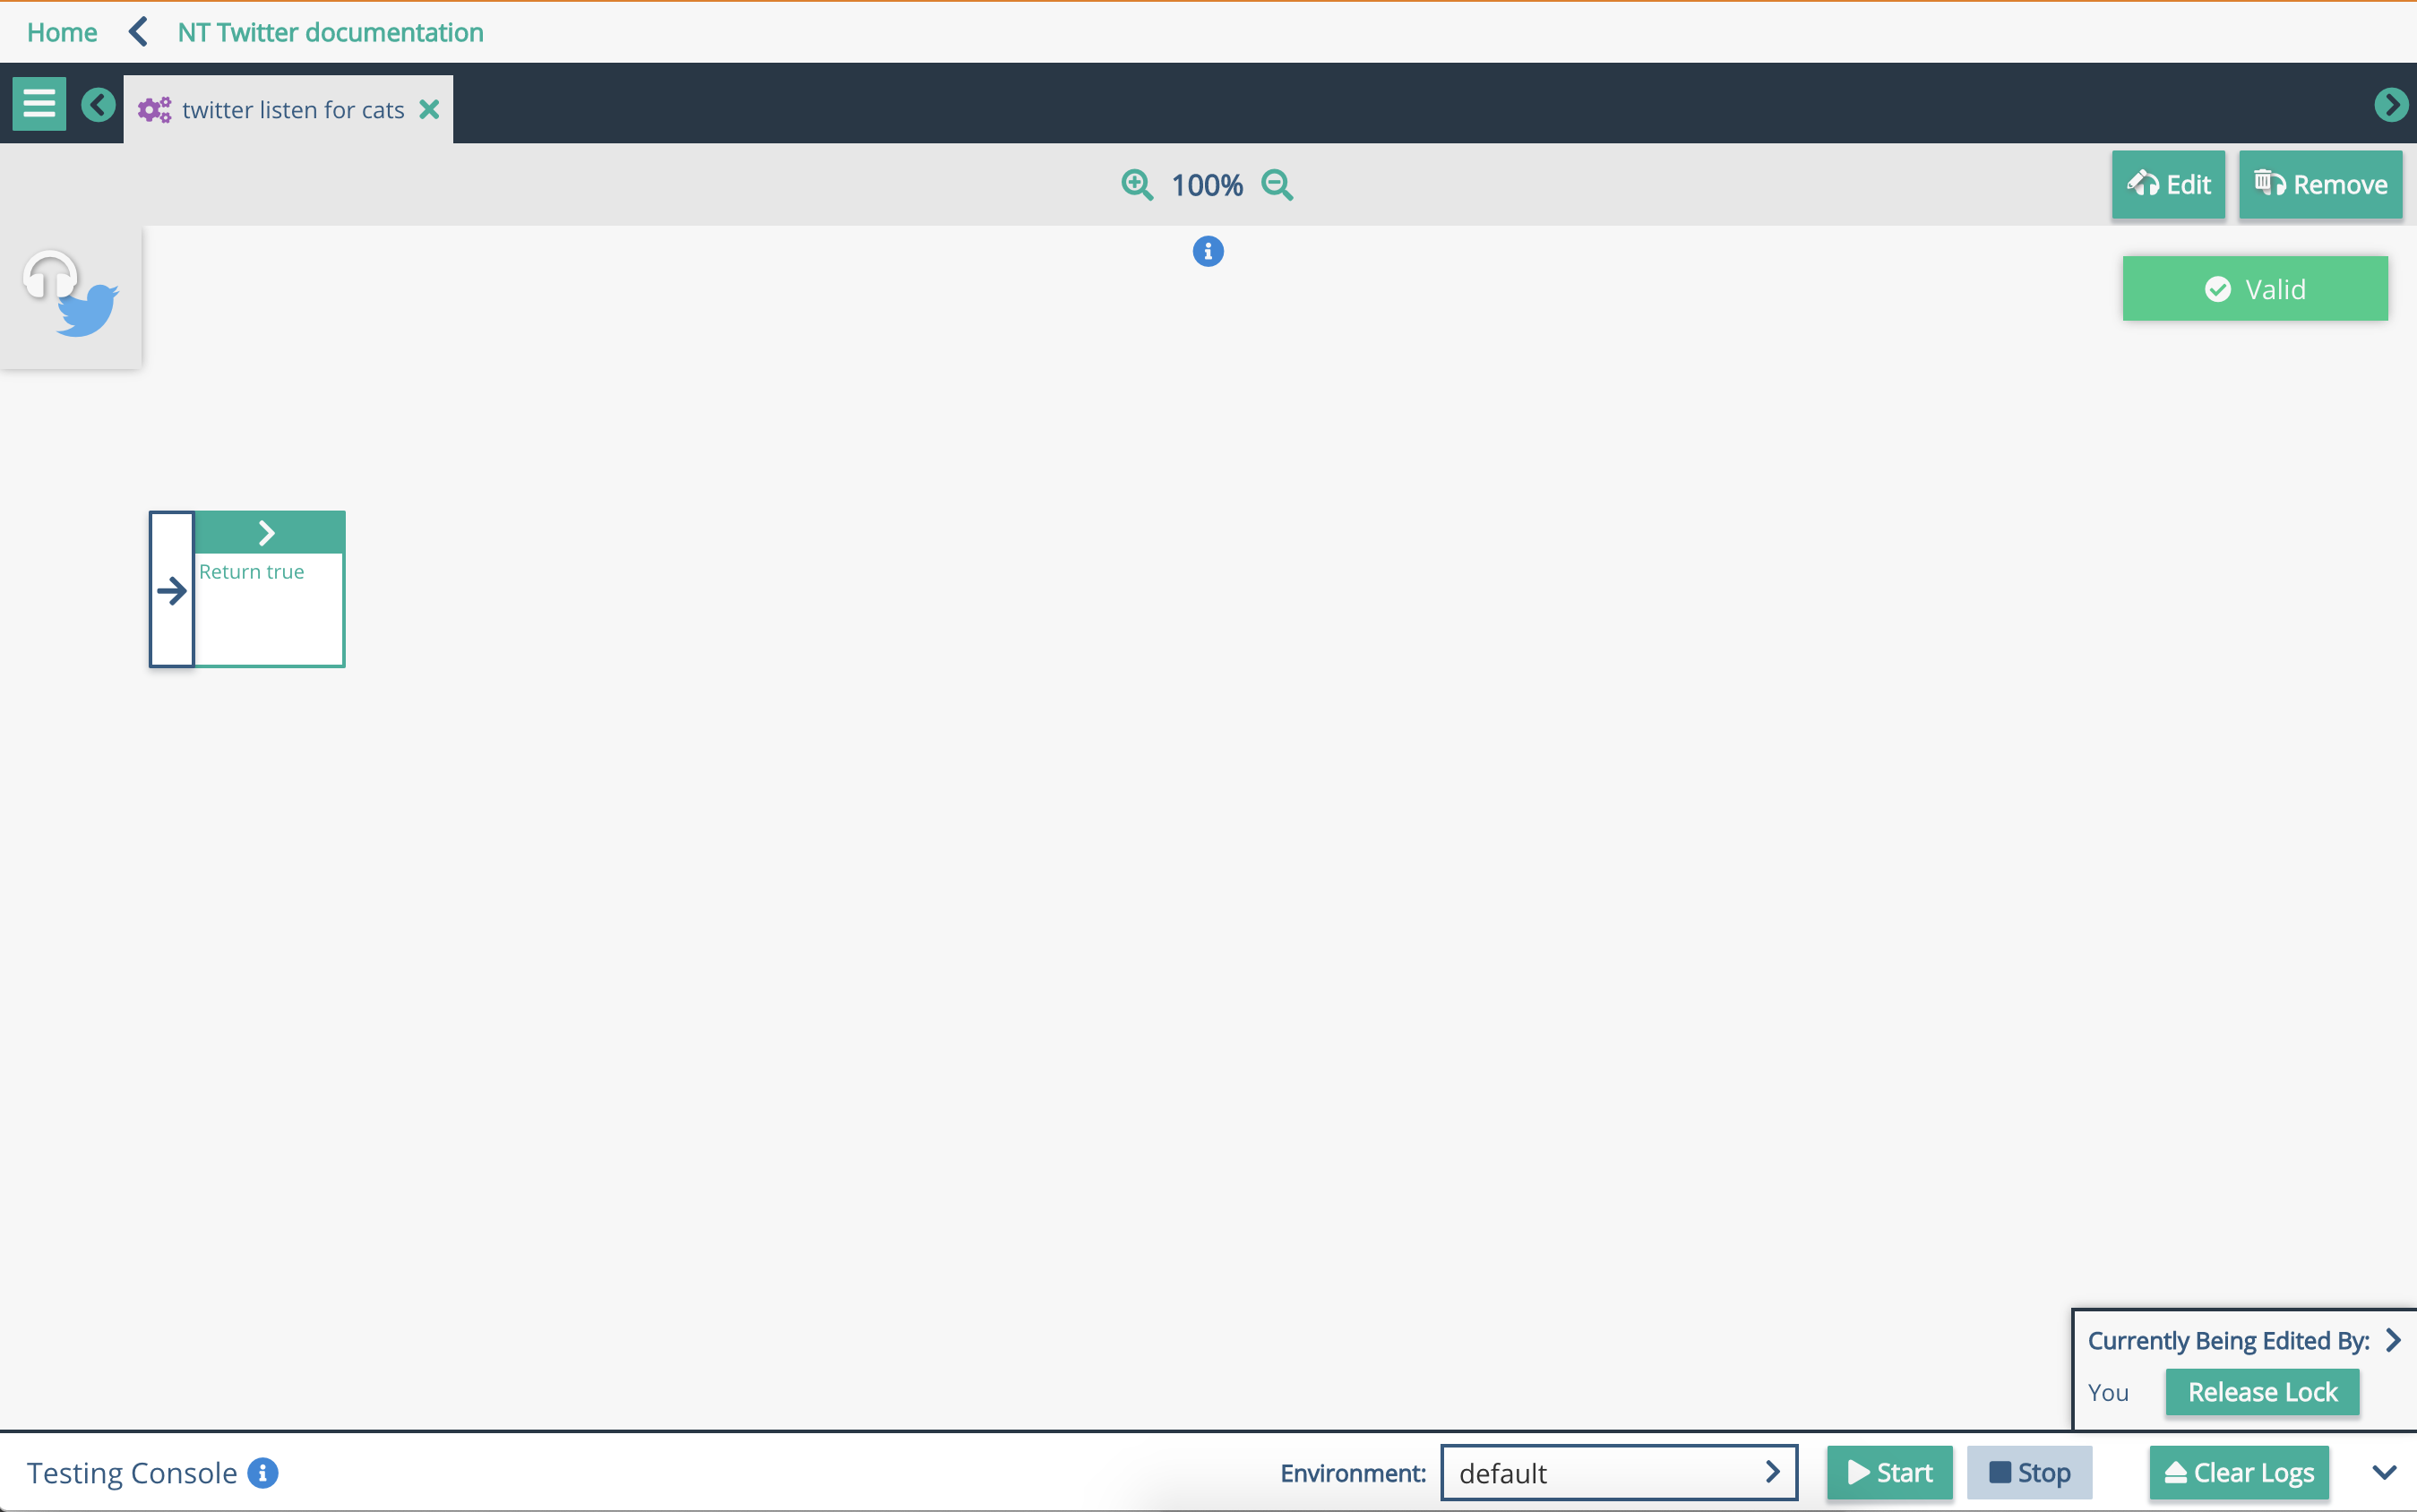
The simplest of graphs is just a return node. Your new graph should have a blank node to start with.
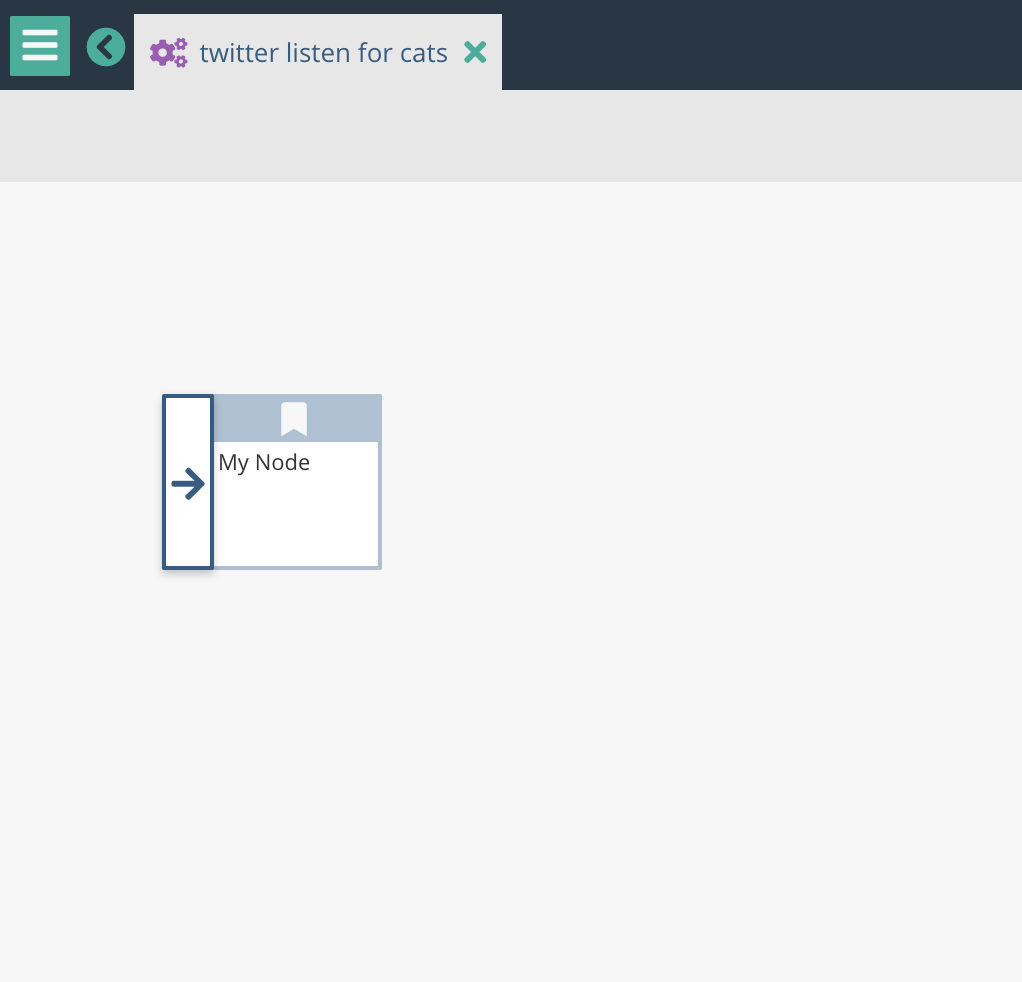
Right click on this, 'Replace Node' and select 'Return'
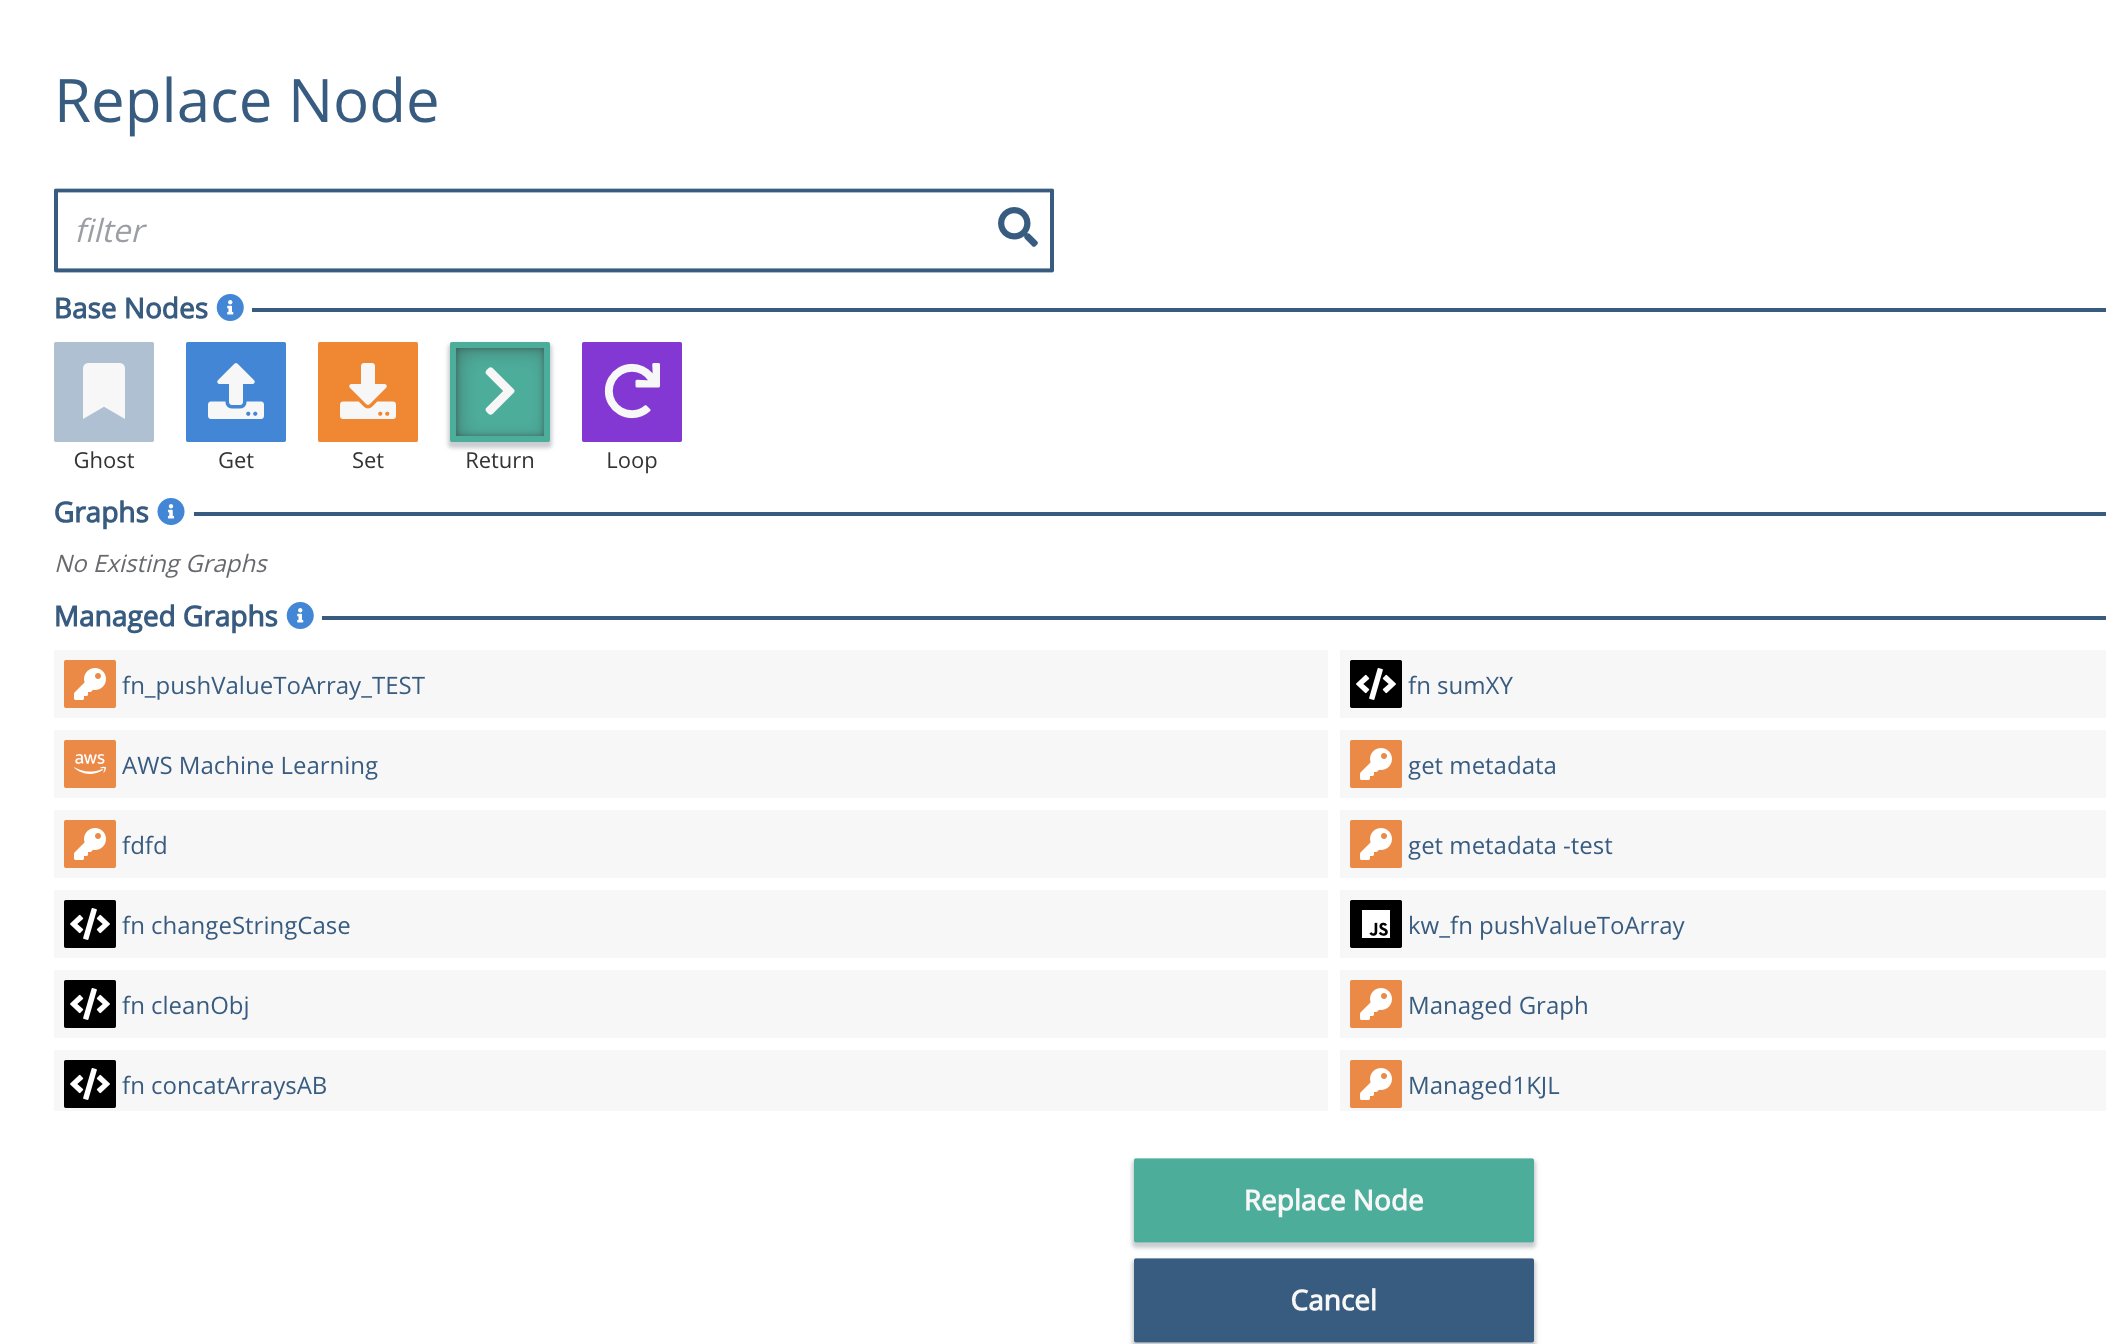
We then need to tell the return node what to return. This can be a literal value, a schema element, or a public variable. In this case, we'll use a literal.
Click on the Return node, and you'll see the side bar on the right change to reflect this. The middle of the three areas on the sidebar allows you to 'Edit Return Node', which gives the slot to put the return value in.
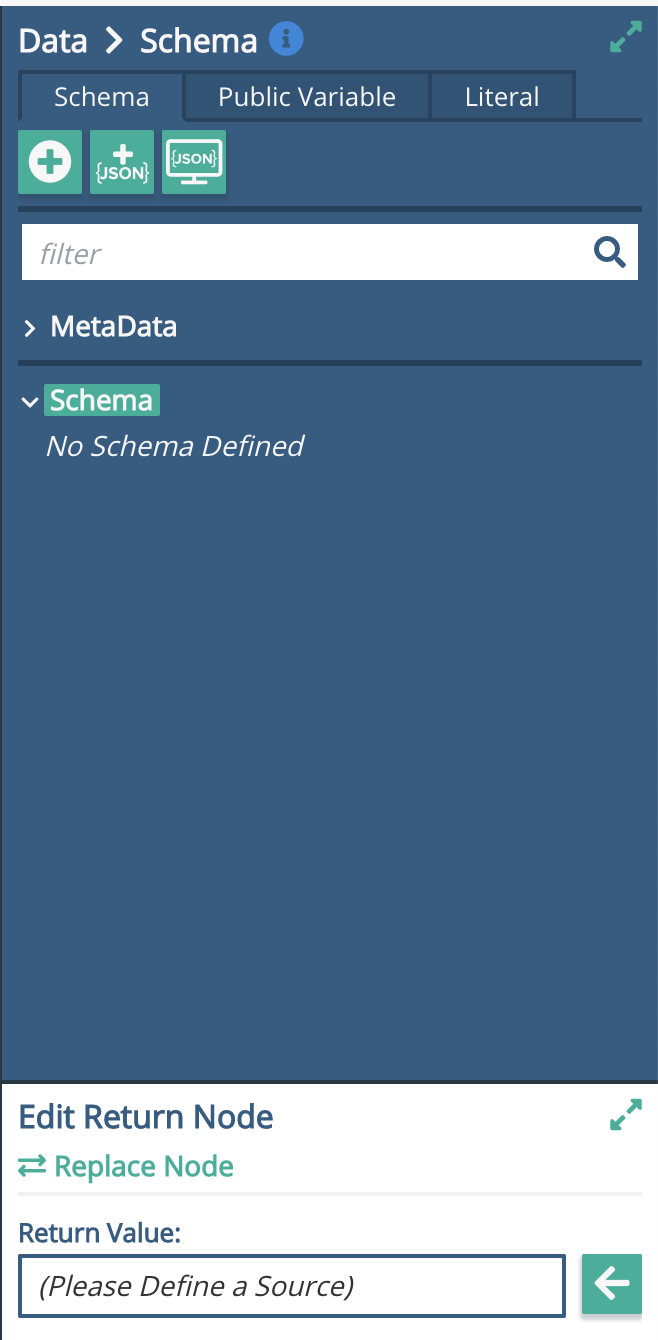
Use the arrows at the top left of the Sidebar to scroll through to the 'Literal' section, then type in a test value such as True.


In the middle section, click the left facing arrow to put the literal value into the output of the Return node. Put the value of True 'into the slot' .
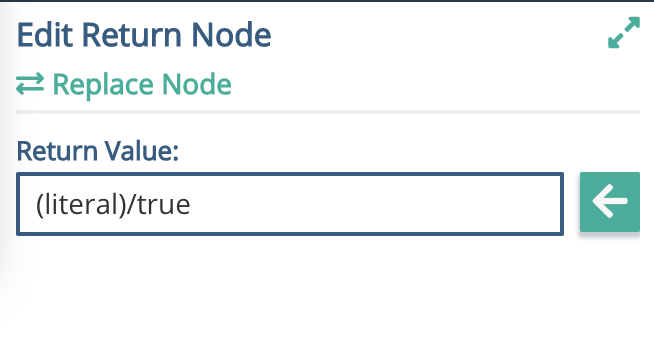
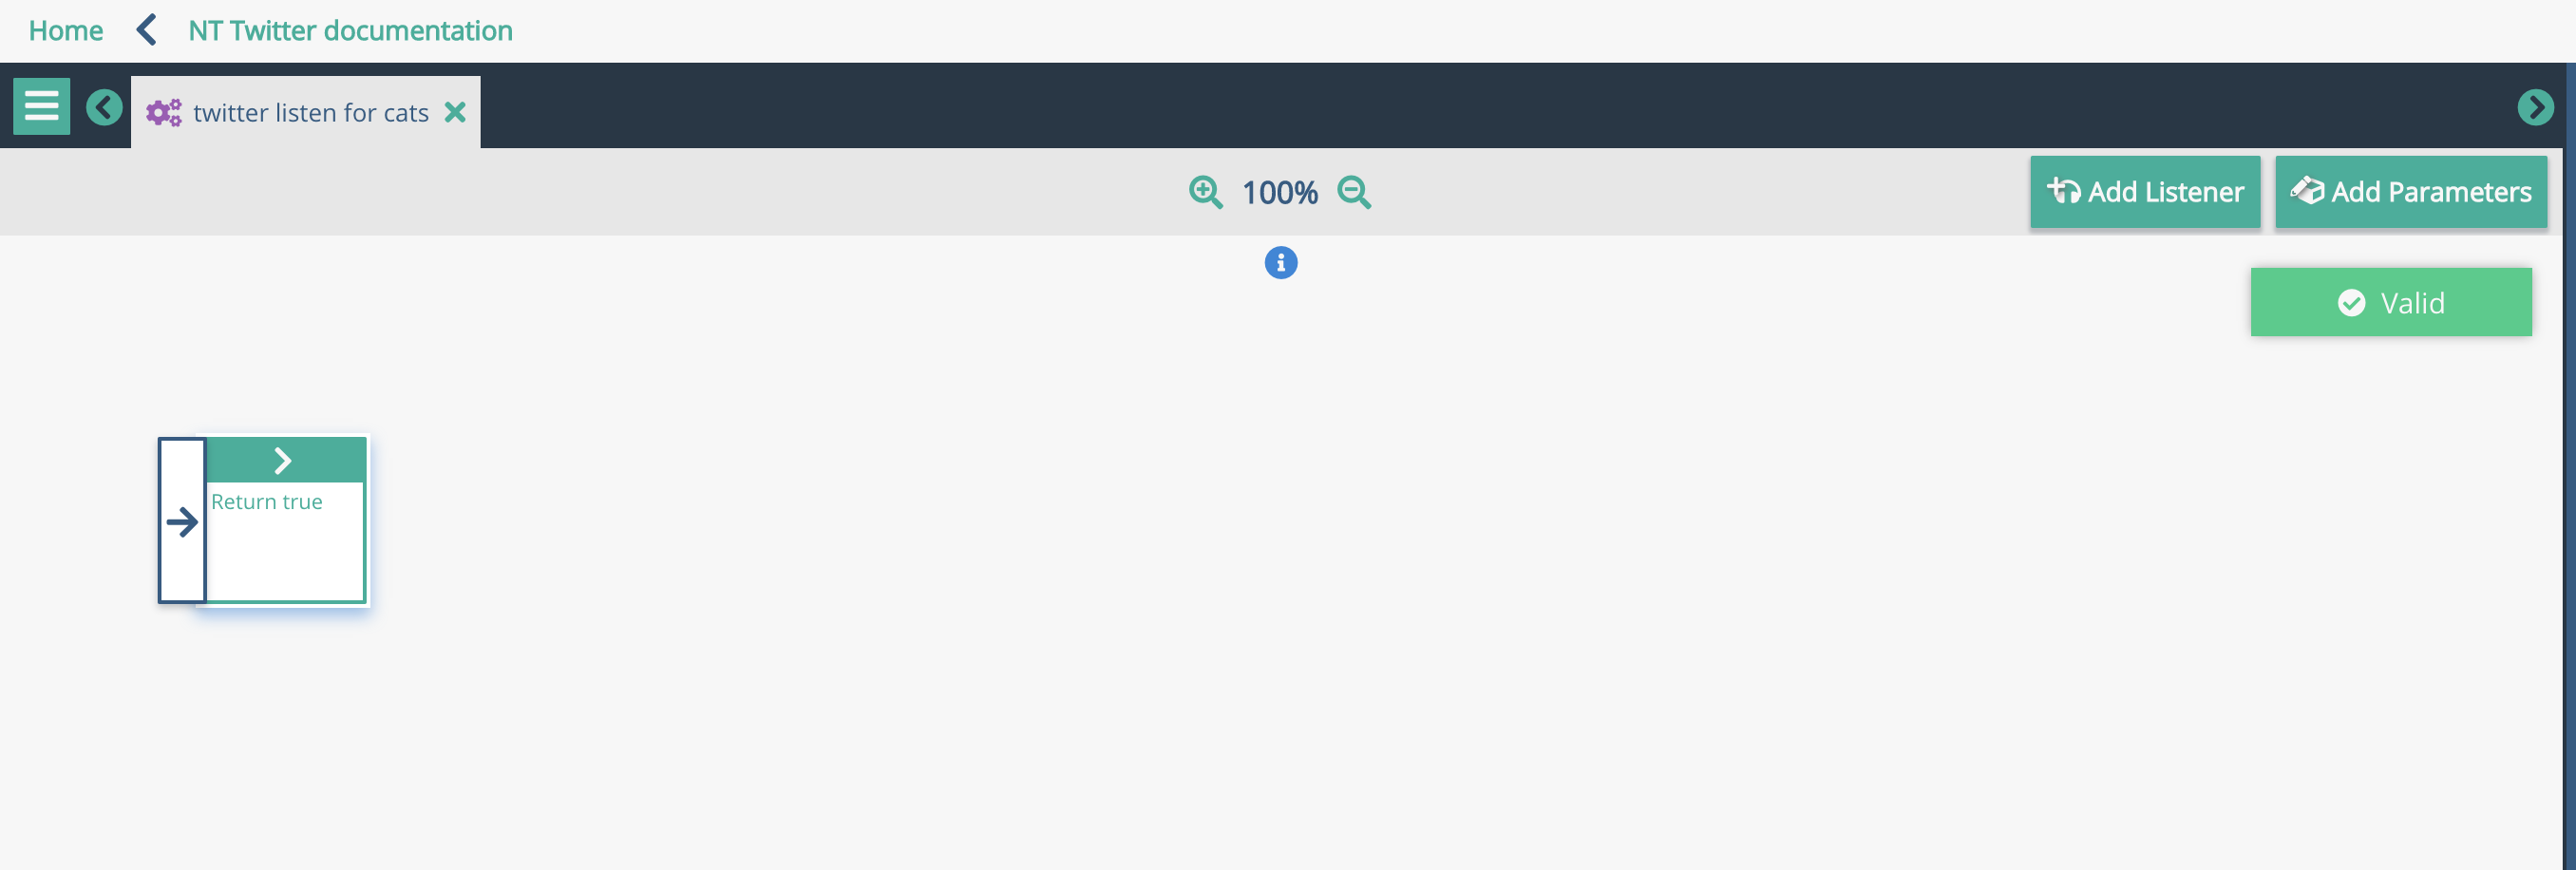
Click the 'validate' button on the screen, and the graph should be valid.
As well as text return, you can also use JSON in the literal return, which will be returned, useful in the case of API integrations. For example
{"status":"ok"}
would return a valid JSON object from the return node.

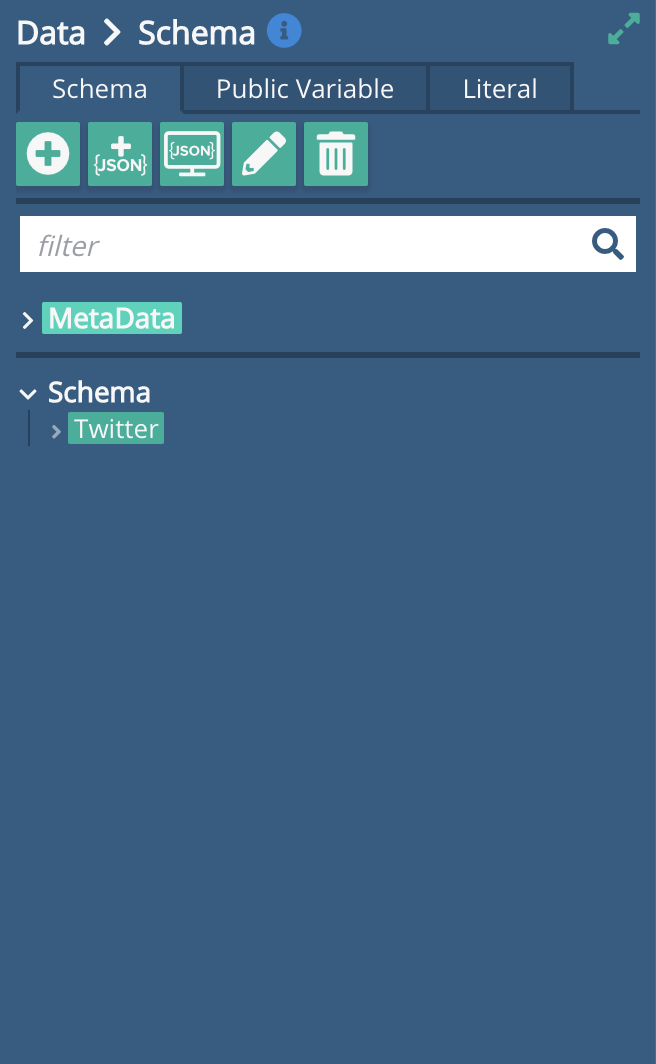
Before adding a listening component to this graph, we must add a location on the schema for data to flow into:
The simplest way to create this is to run one event, grab the JSON it creates, then create the rest of the schema based on the acquired schema.
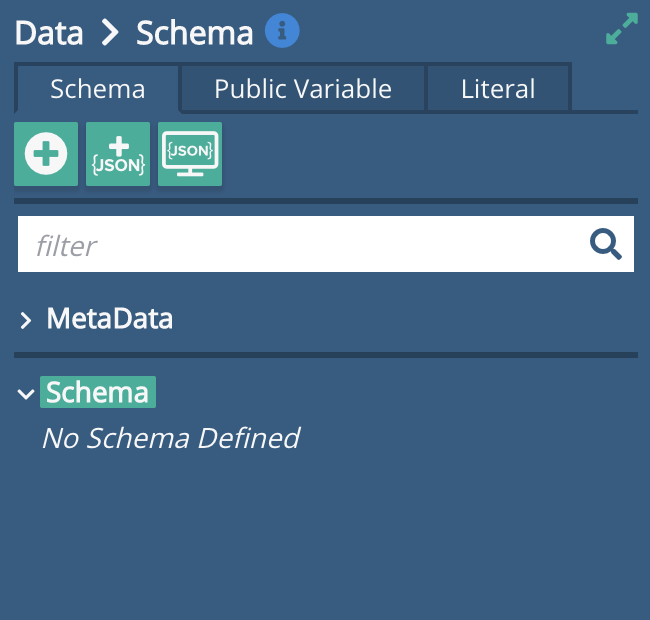
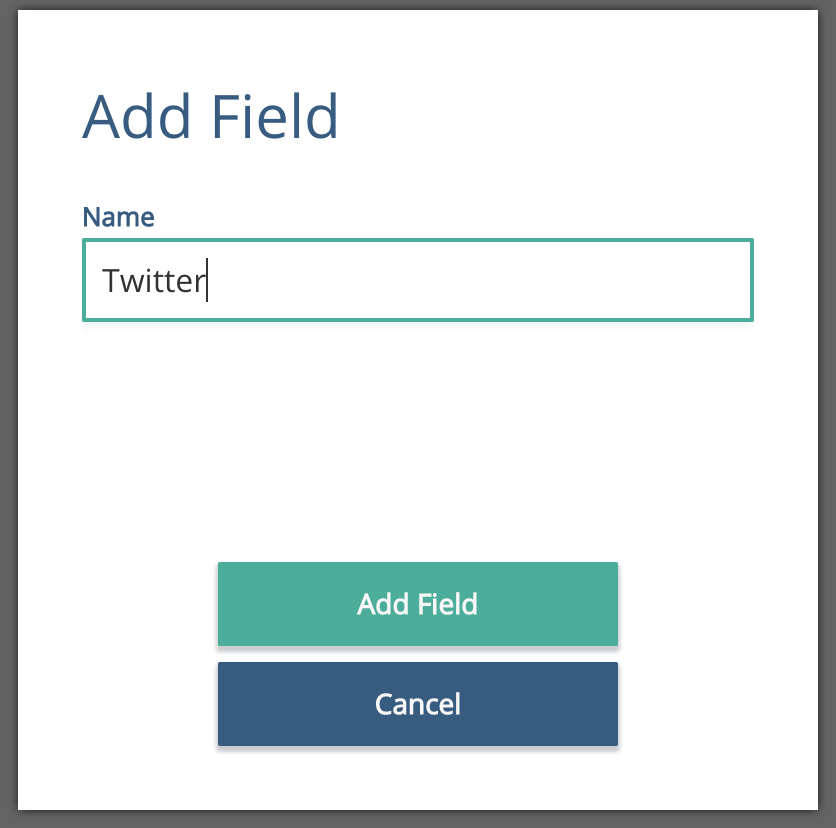
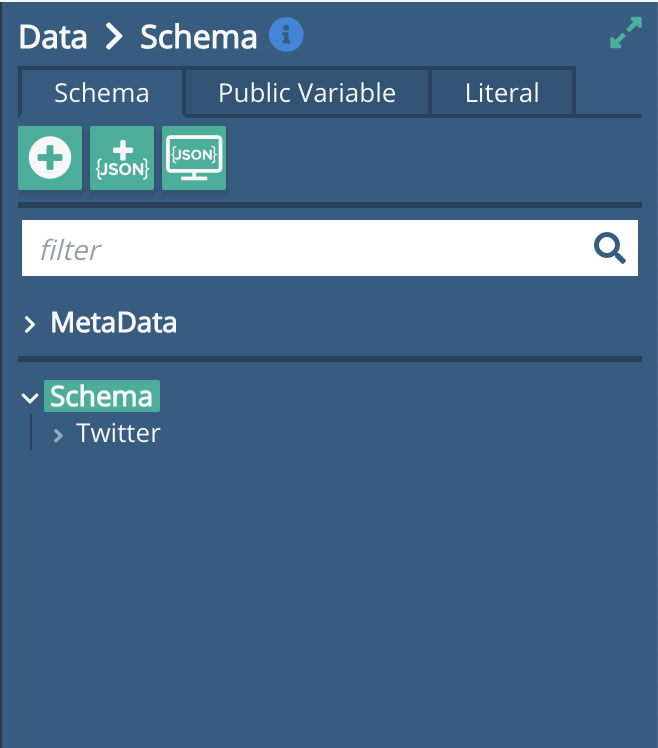
The first thing to do is add a 'Twitter' named child to the top level schema.
From the Sidebar, with Schema selected, click on the big plus sign on the top right of the sidebar.
Adding the Twitter Listener:
To make this graph into a listener, you need to click the headphones 'Add Listener' button on the top right.
Here, you get options to add listeners to Databases, queues, APIs, or Twitter.
Select Twitter from the drop down, and select the Adaptor Connection to be the one you have just created.
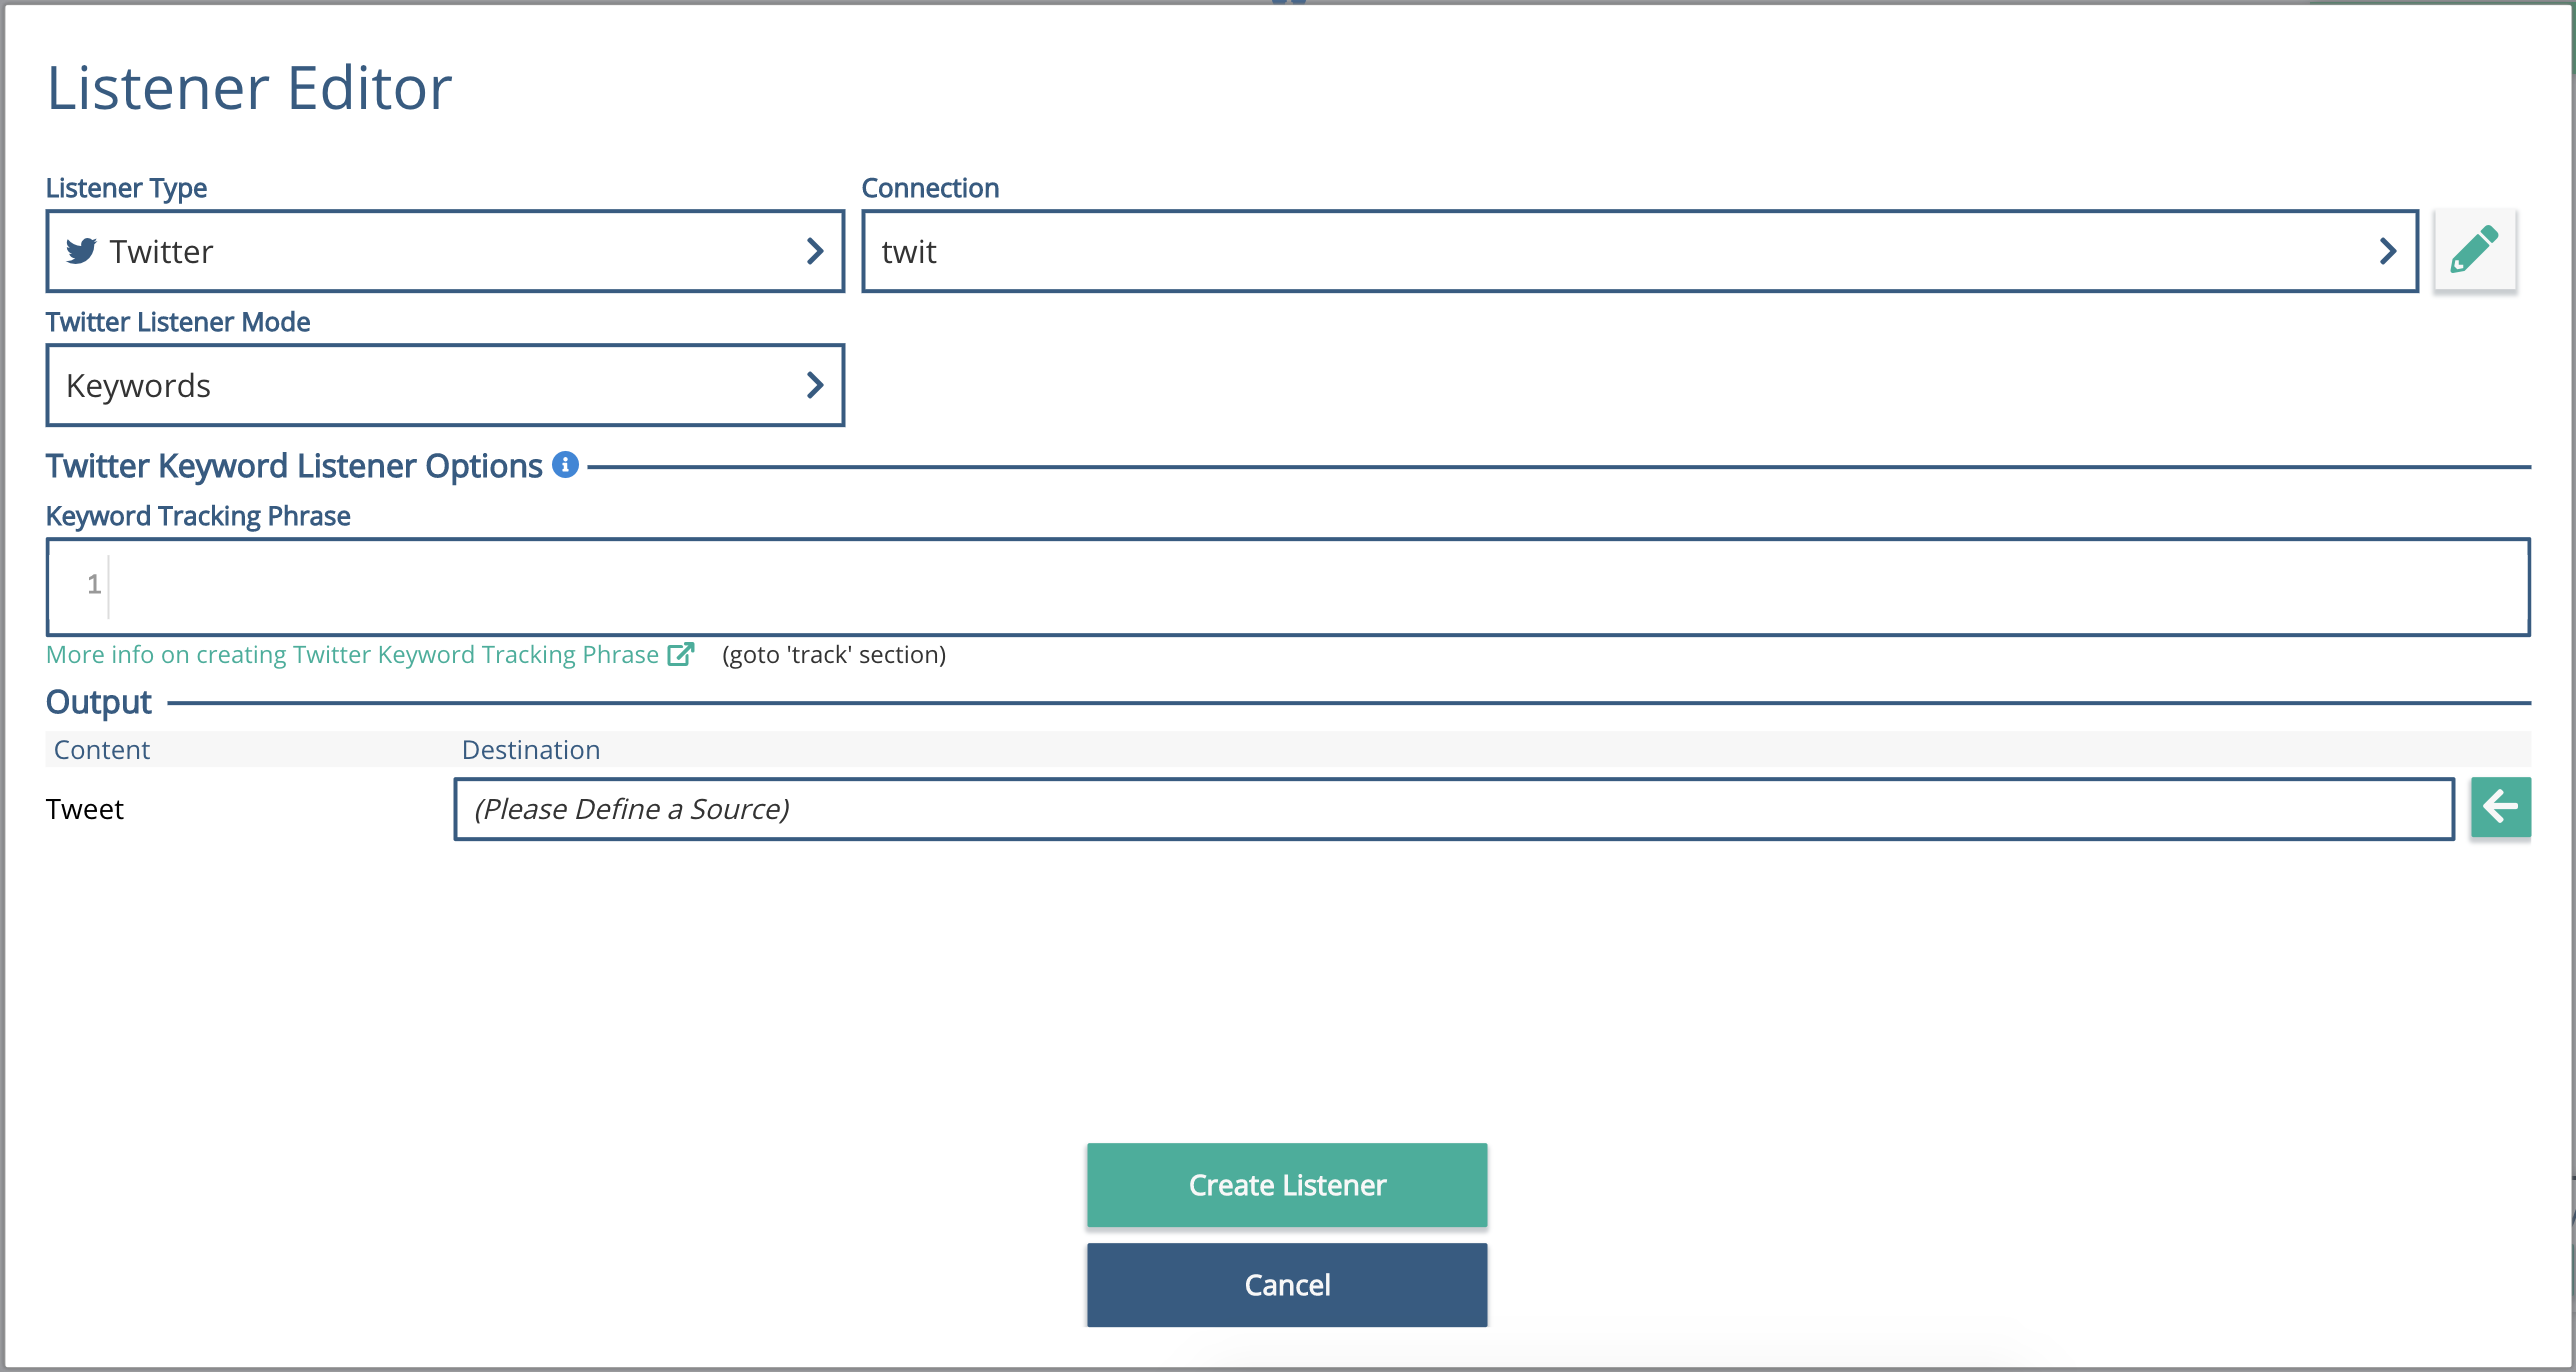
You can change the Listener Mode to listen to Keywords, as we'll do here, or to a User Stream.
Add 'cat' or 'dog' into the Listener Options.
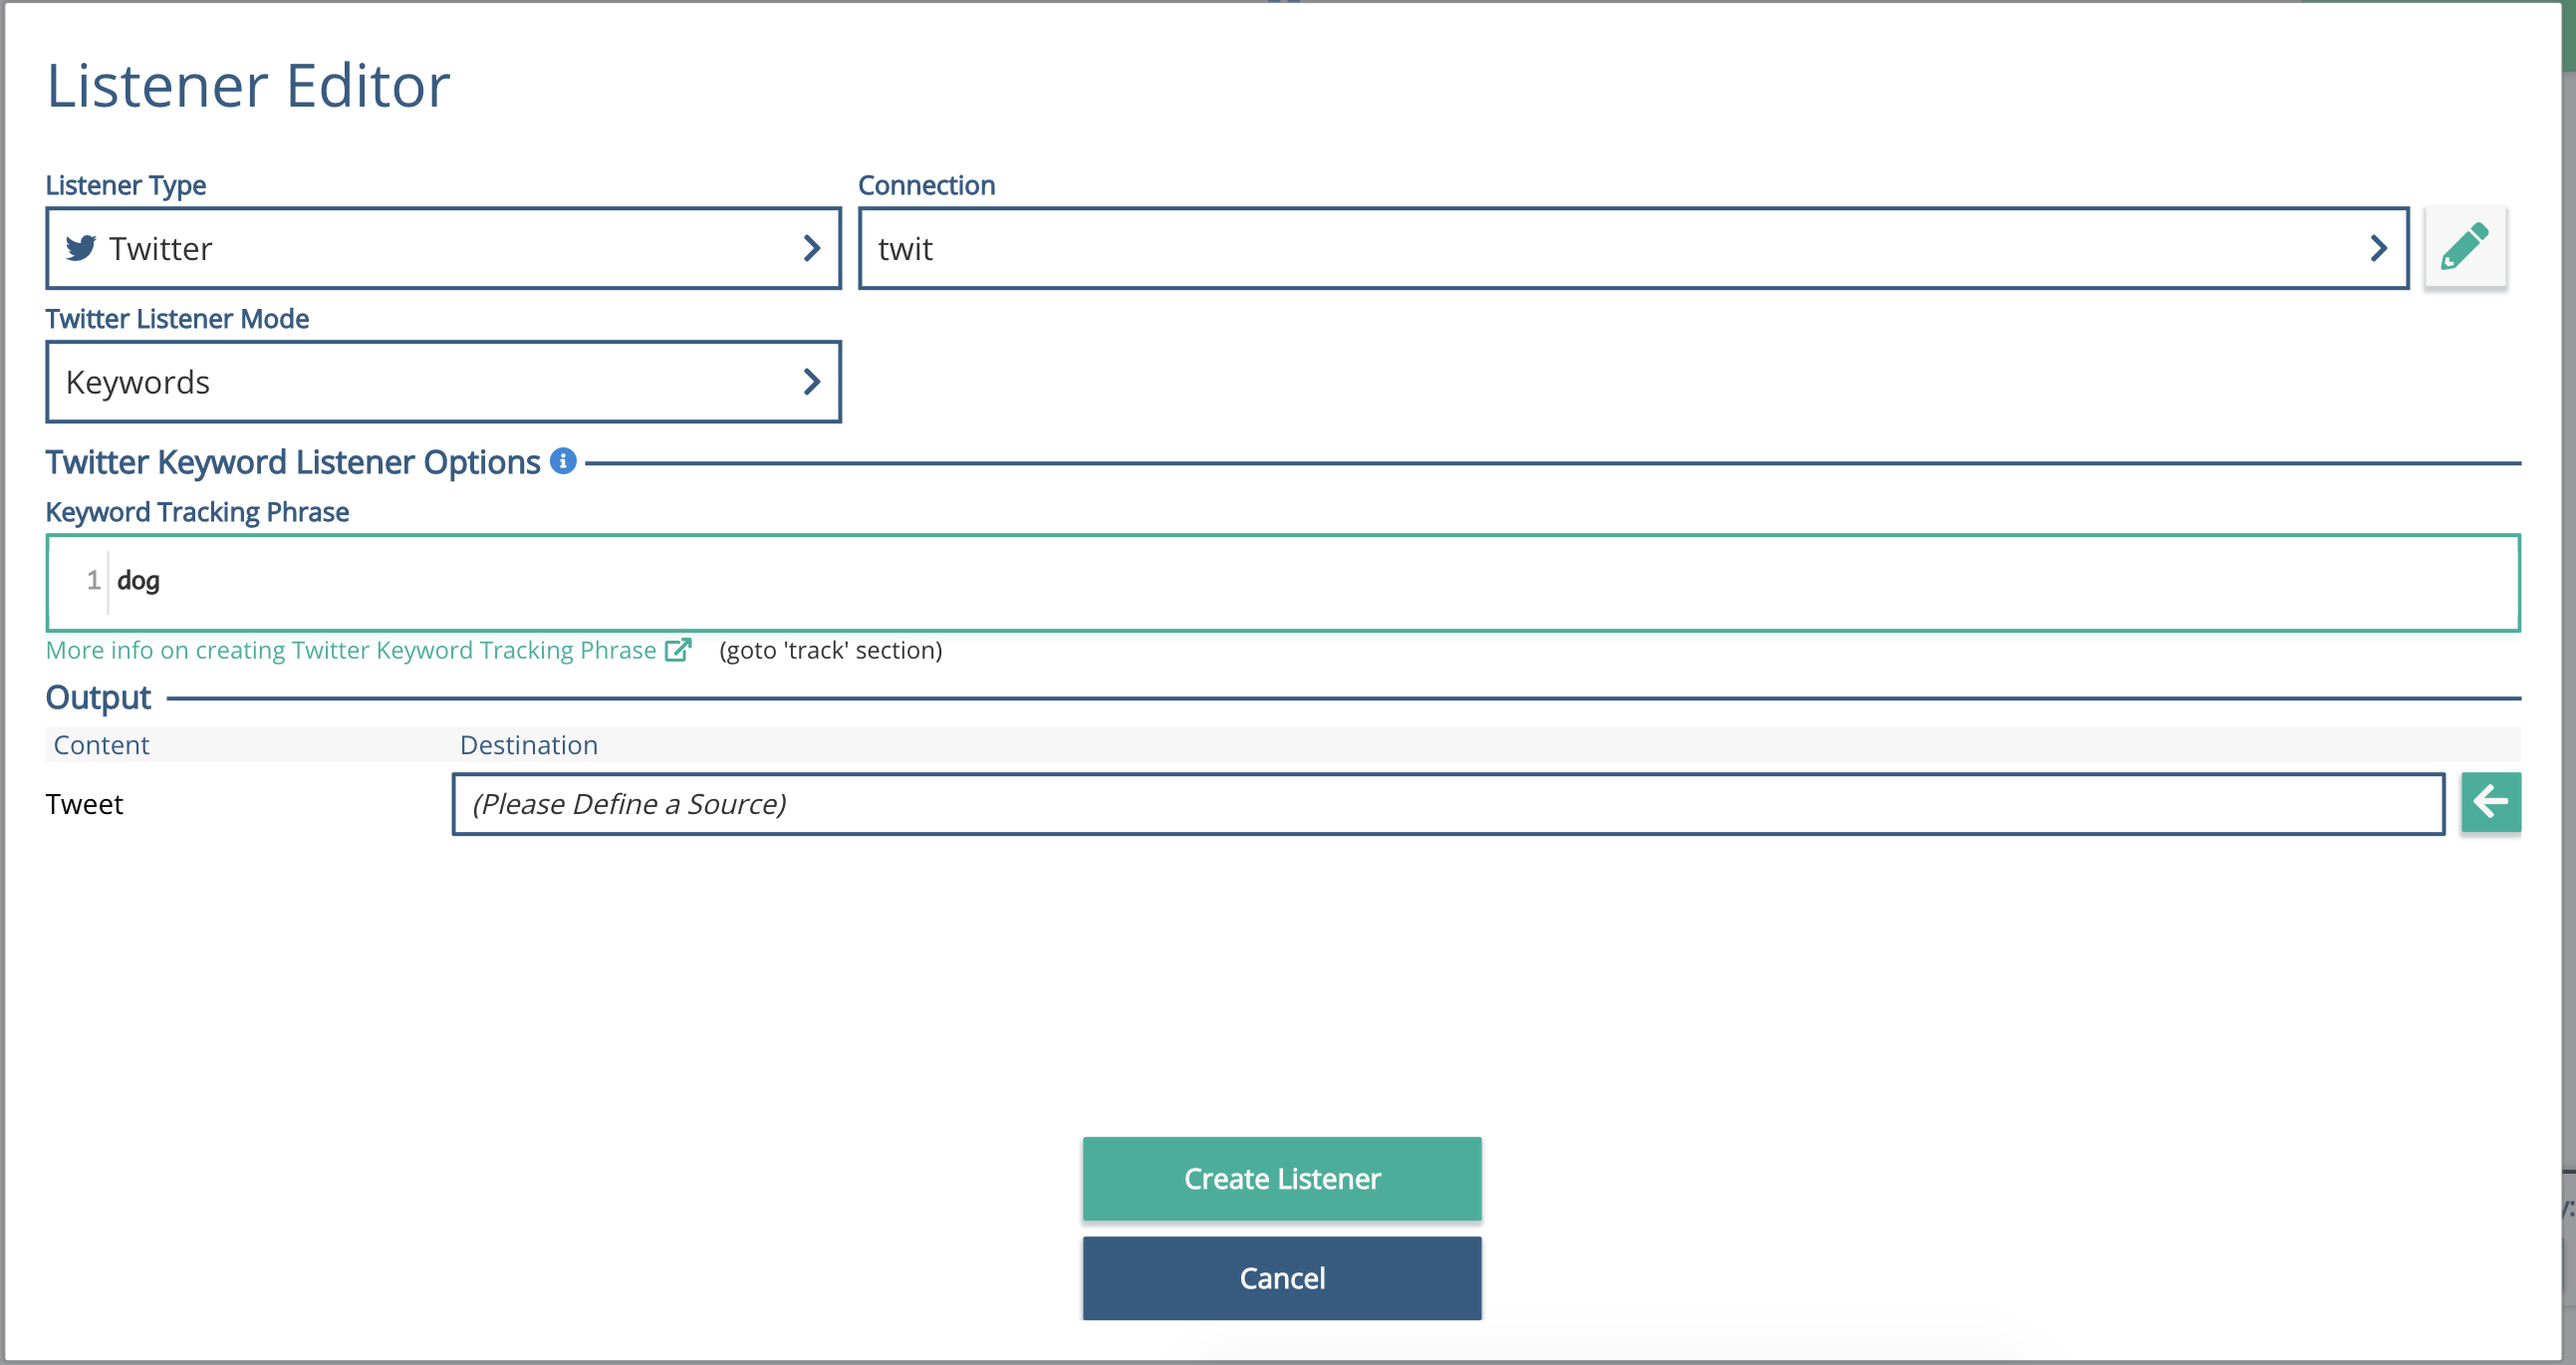
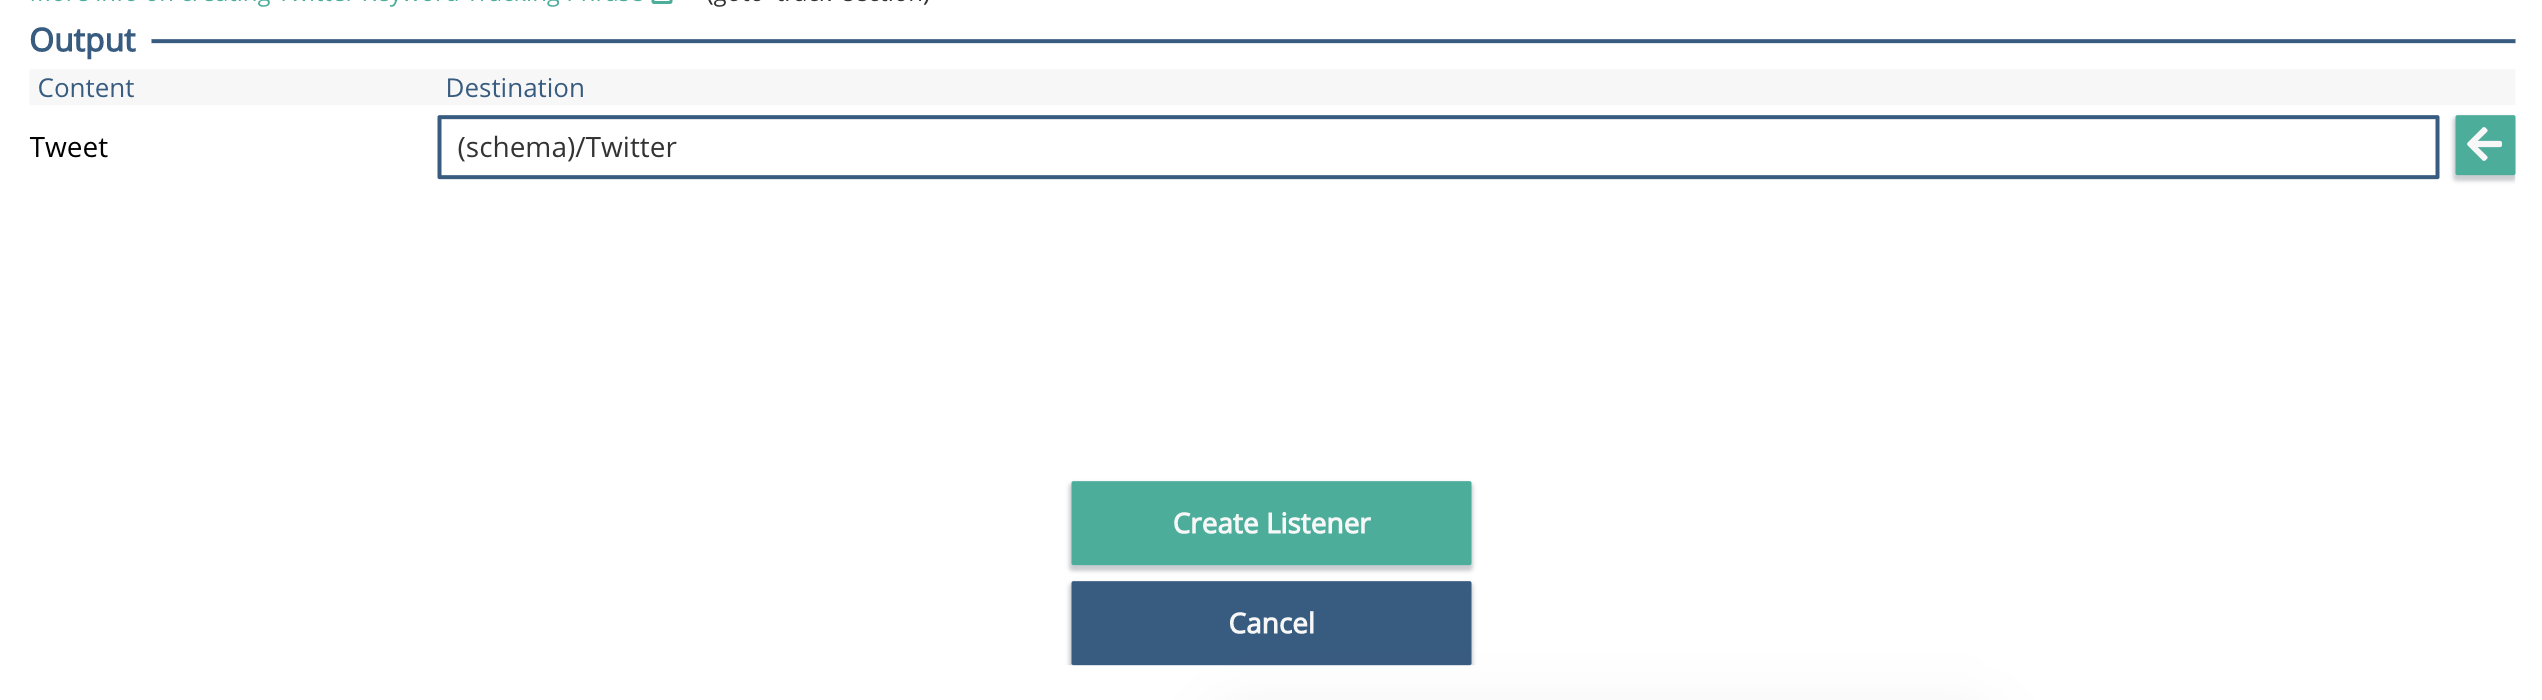
Output Section of the Twitter listener:
Click on the Twitter element, so it goes purple, then click the left arrow next to the Output / Tweet / Destination box.
Click the arrow to the right of the text box that reads 'Please Define a Source'. This will input the schema temporary to the Twitter listener output. Click 'Create Listener'.
Step 4 - Populating the Schema
We now have a simple graph with an added Twitter listener at the top left of the page. When the graph is running the Twitter with headphones will pulse.
You can test this, by bringing up the test console. Click the arrow at the bottom right of the screen next to the clear logs button.

Click the up arrow bottom left to bring the console into the working screen.
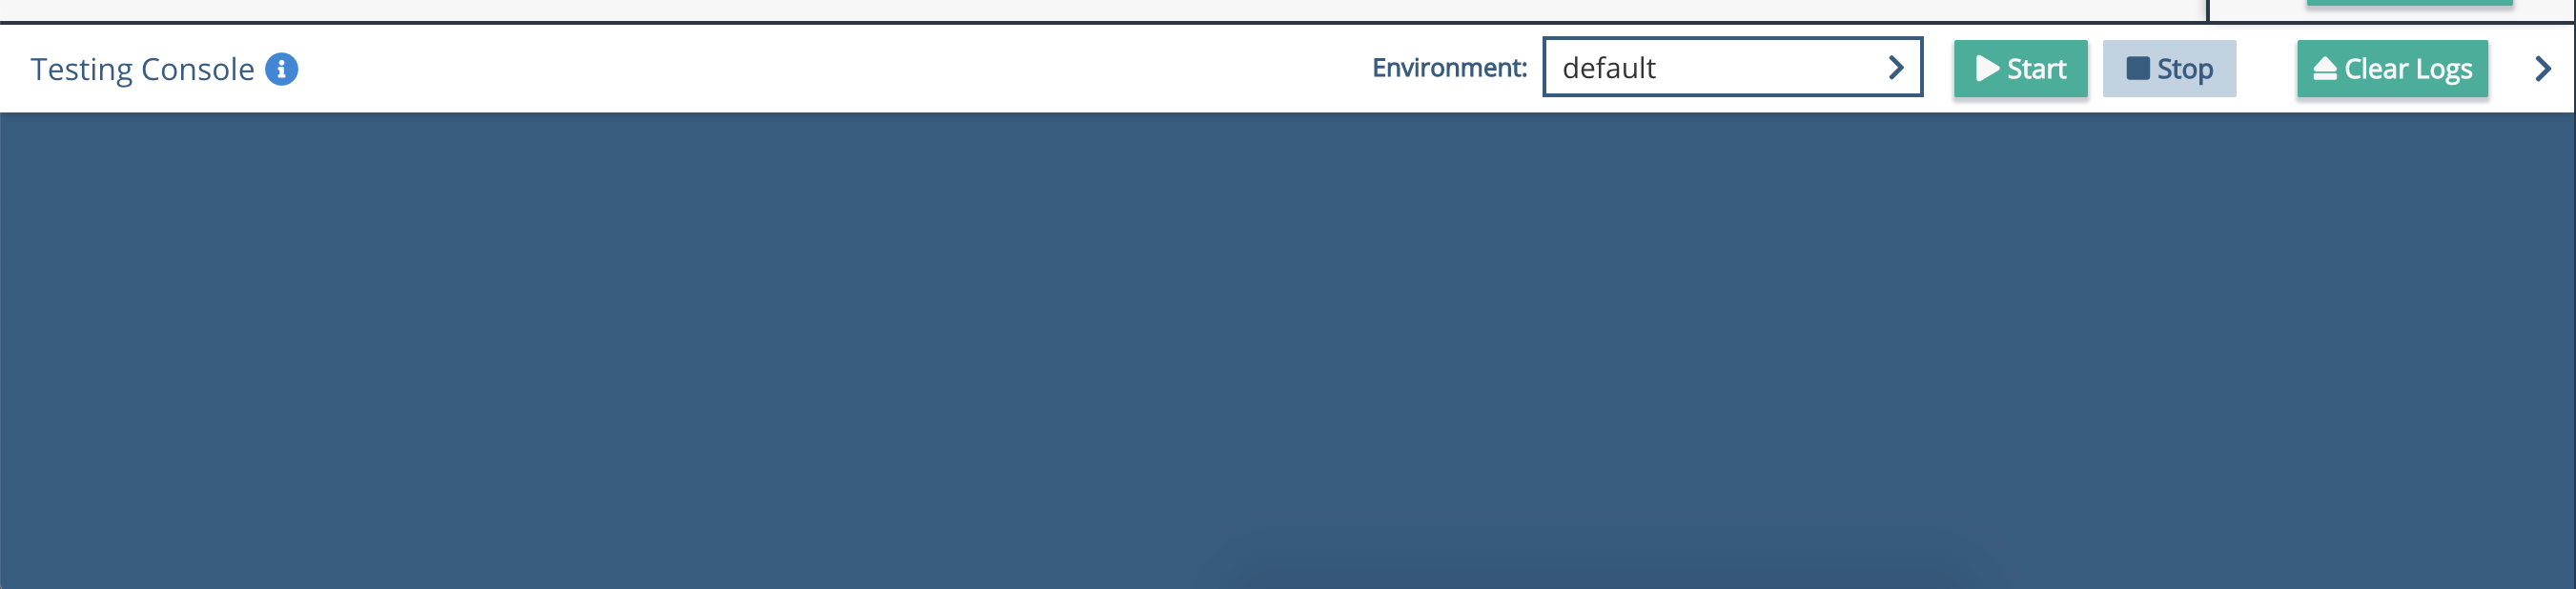
Click 'Start' and then set the iterations to be 1. If everything is set up as expected, you will see one tweet come into the listener graph, and a result appear in the Testing Console.
Click the plus signs on the record in the Test Console, and you will expand and see the results of the test.
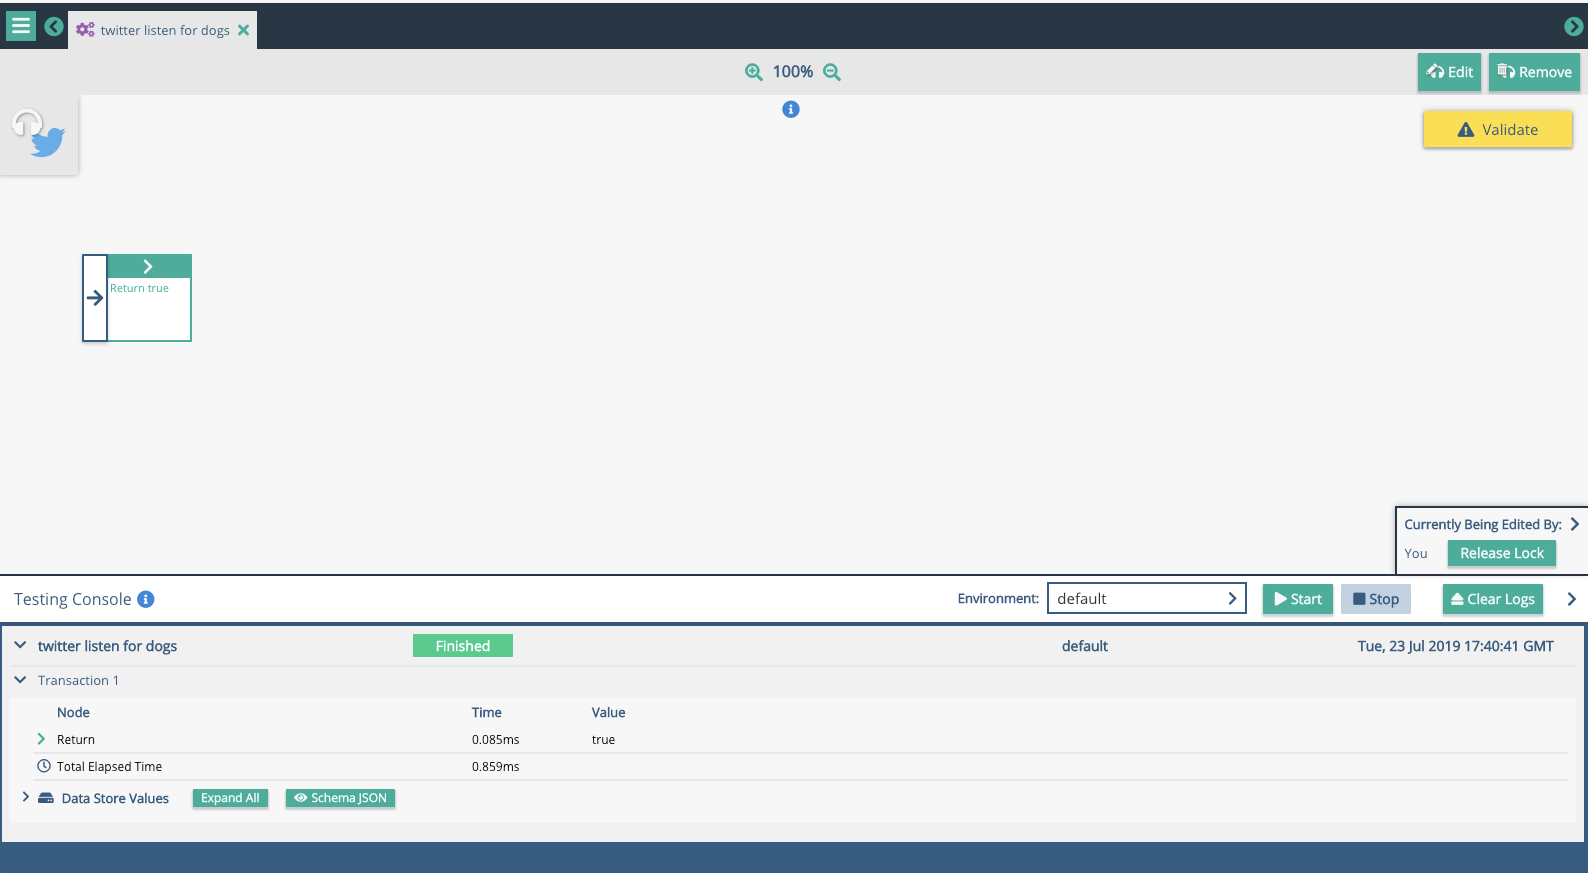
Clicking on the 'Schema JSON' button to show the JSON structure created by the listener. You can use this to enhance the schema, and create a full Twitter Schema to hold the elements for each tweet.
Select all, and copy the JSON from the Display JSON window. Close the window, then head over to the Data Schema area of the Sidebar. You will need to delete the existing 'Twitter' element of the schema (highlight it, press the bin / delete icon top right).
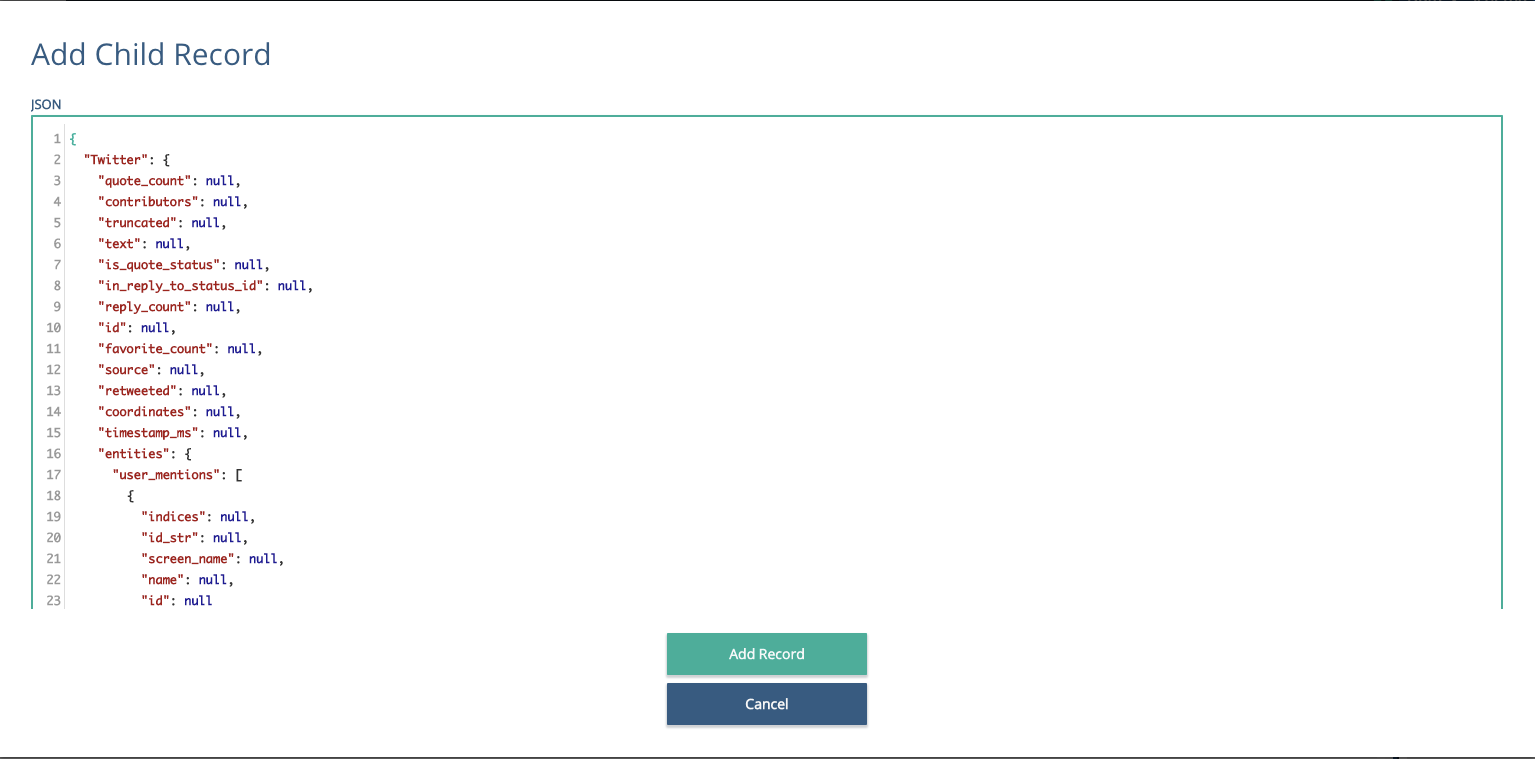
Then click the +{JSON}  button, and paste in your JSON copied from the Testing Console.
For best results, take the below provide object and paste it into the Add Child Record jSON text box.
Save this, and you should now have a full set of twitter elements in the schema. One thing to check is that you have a 'retweeted' set of elements in your schema, if you are interested in these. If the tweet you captured hadn't been retweeted, it might not have those schema elements, so it's worth checking to see you have this if you are going to be using them.
You might also want to rename the top level 'Twitter' element to be 'Tweet', as technically that is what you are putting in the schema, rather than 'Twitter' itself.
Once you have done this, if you validate your graph again, you will find it invalid. 
You need to click 'Edit'  the headphones listener Icon, and re apply your new schema element to the listener output. With the focus on the top level 'Twitter' (or Tweet) element, push this into the Tweet output slot in the listener. and SAVE this. Your graph should validate.
Now you have a way of capturing data from Twitter about Cats or Dogs, you can now thing about doing some checks on the inbound data, some segmentation, and storing it somewhere.
Step 5 - Database Connection
Starting with storing it somewhere, set up a Database sub graph to insert details of the tweet into a database. To do this you will need a database adaptor
You should have access to 1PasswordForTeams, which will give you database credentials to access the database Xponent have provided for you.
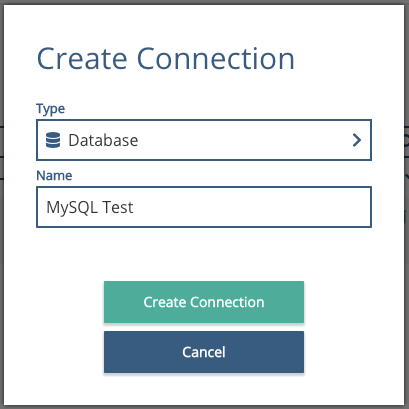
To set up the database connector, go to the admin page, click on the 'Connections' ribbon and 'Create Connection'.  More info can be found on connectors here.
Give the connector a name, and create the connection
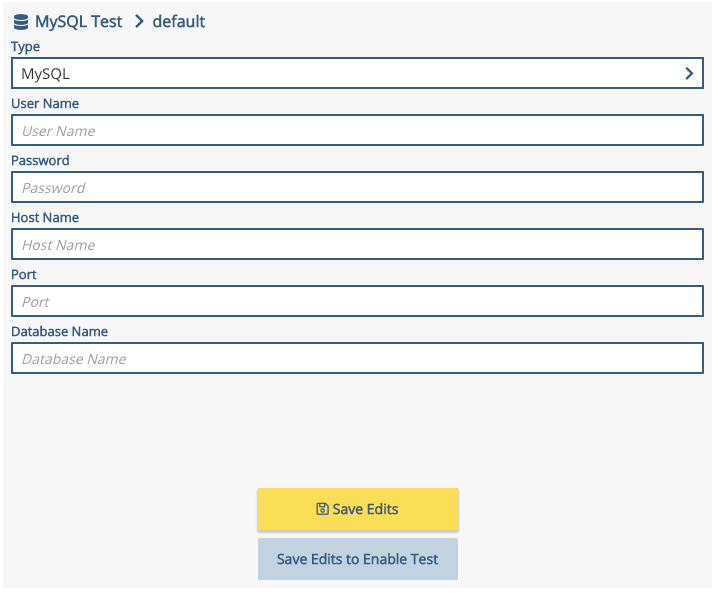
You will need to add the connection string into the connector box,
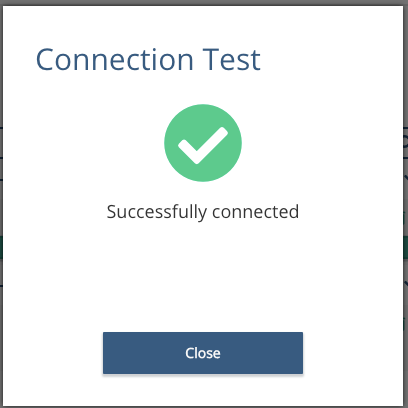
Hit 'Save,  and test the connection.
Hint: Not seeing a successful connection? Check the "type" drop down as its pre-set is PostgresSQL
Now we have a connector, we can use this to 'write' data to the database.
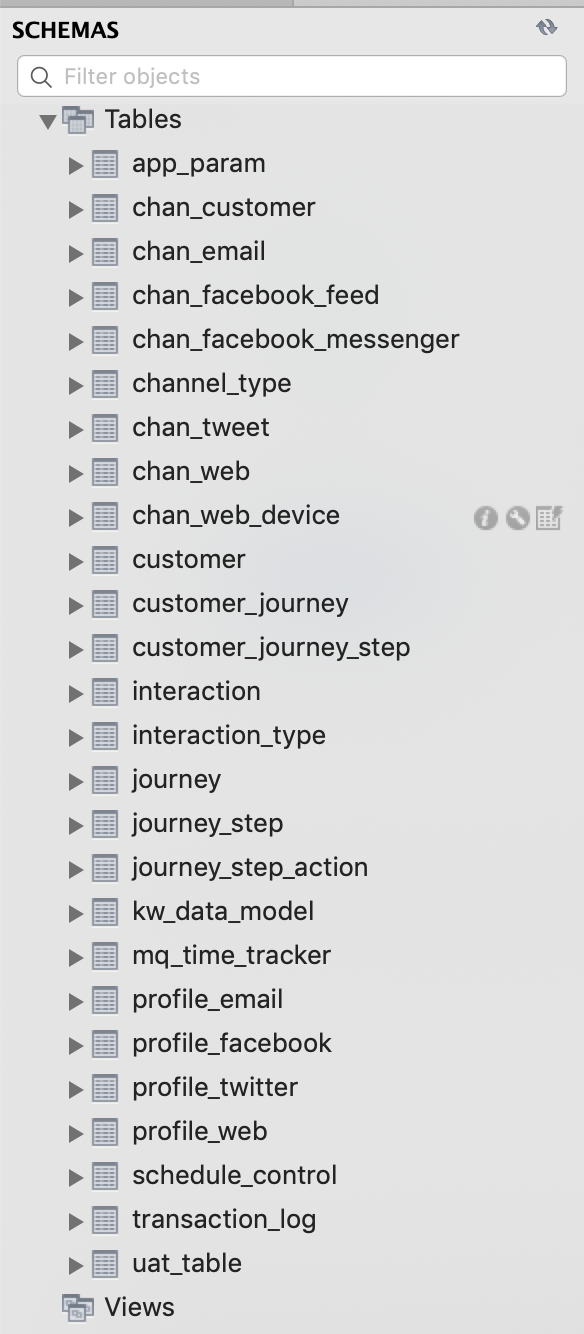
Are you using a the most recent version of the CDM? If you just connected your Xponent provided mySQL database, you're all set! All the tables needed for the following tutorial are populated. Your database schema will look something like this...
Still confused or using a standalone database? Here is some SQL script to create the chan_tweet table:
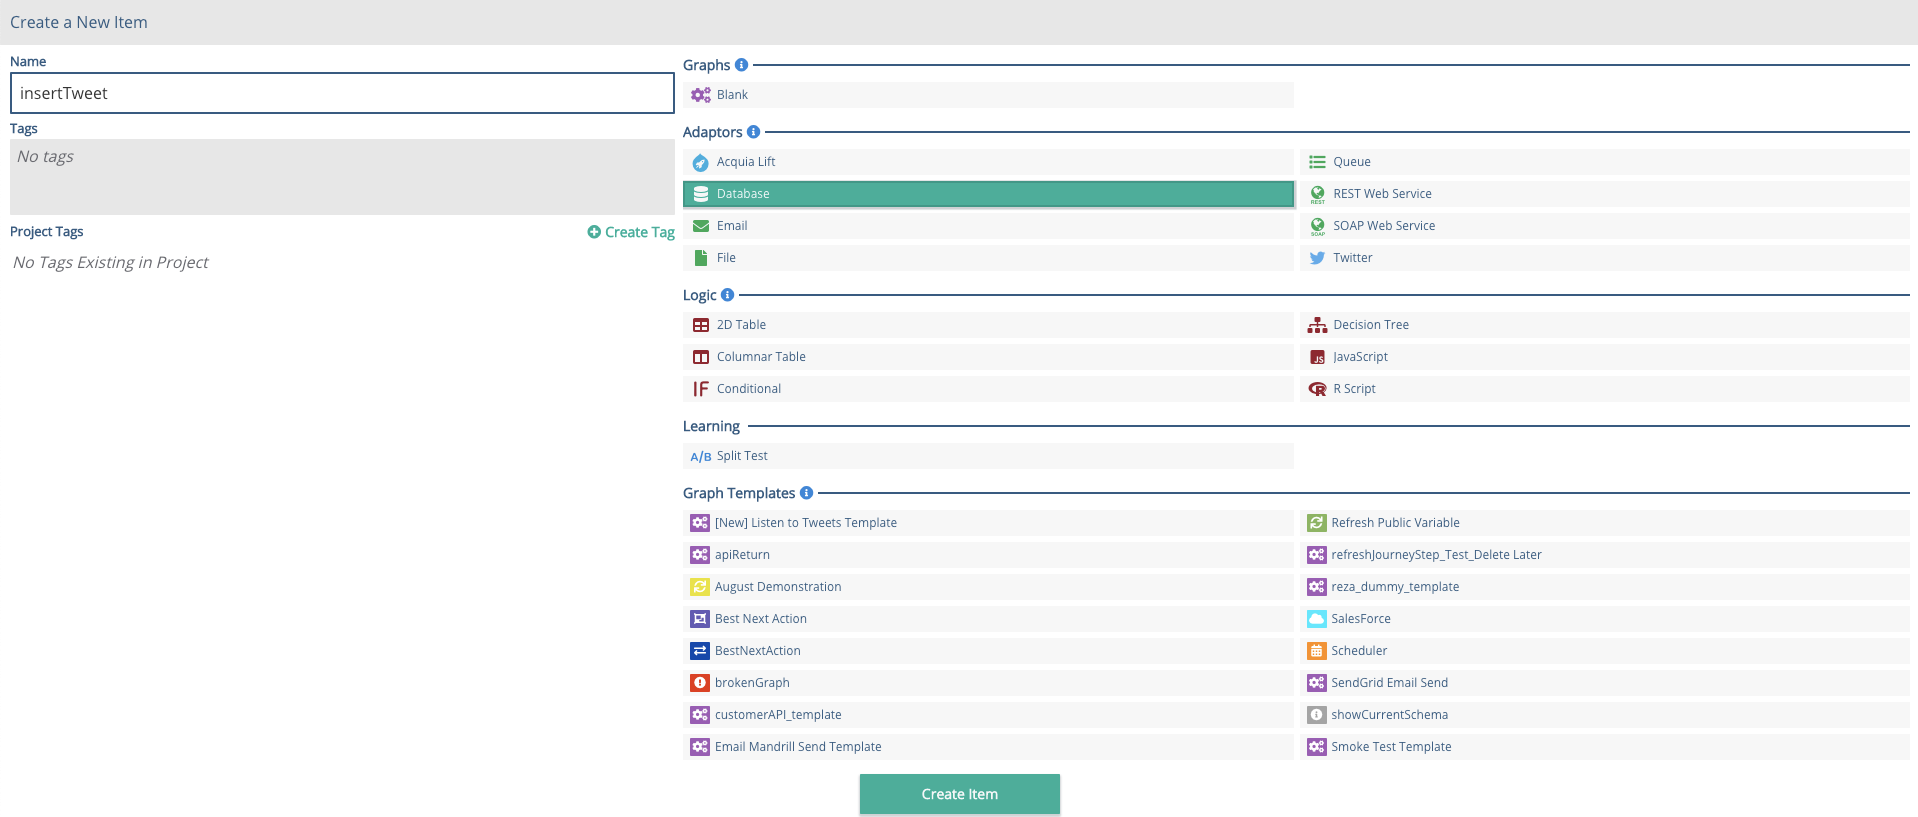
Back to the Hub: From the top left, 'create new' and select Database Adaptor, called 'insertTweet'. From the first drop down, select the connector you just created 'MySQL Test'. Set the database action to be 'Write', as we are writing the tweets to the database.
It helps at this point, to have access to the database via MySQL Workbench, or another client that gives you access to the database. This will help troubleshoot any issues you may encounter, and ensure you have the right tables etc in place to write into! You should have a table called chan_tweet in the database anyway as part of the initial set up.
In the 'Write Query' box, you will need to enter the following SQL
INSERT INTO chan_tweet (tweet_id, tweet_text, user_screen_name)
VALUES ( %%tweet_id%%, %%tweet_text%%, 'Kai')
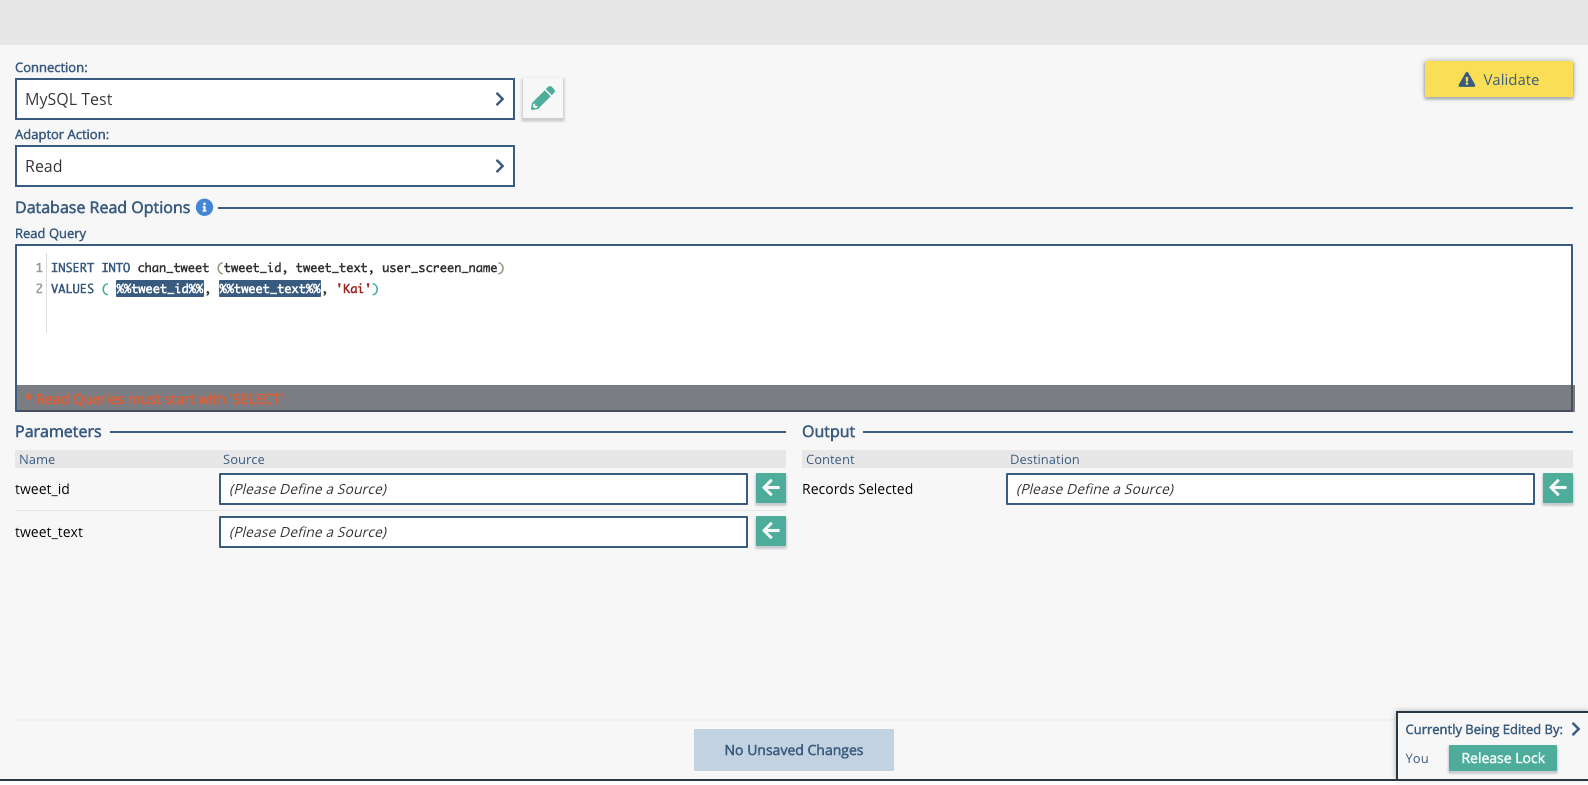
Parameters in Xponent are done using the %%parameter%% notation.
Once you save this, you will see the input parameters you have specified appear in the box below.
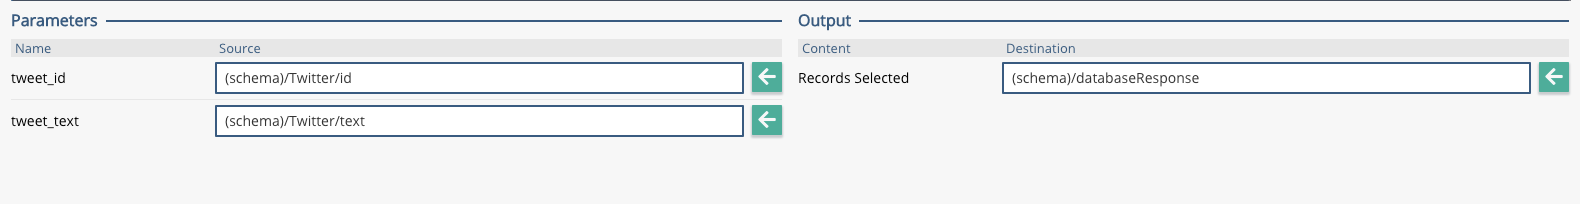
Find the tweet_id in the schema, and put in in the slot. Same with the tweet text, find it in the schema, put it in the slot. You can also create an output destination for the database response. To do this, go to the schema, manually add a child field, called databaseResponse. Put this into the Output slot.
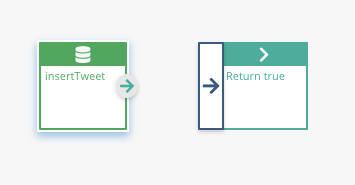
Now you can build this into you listener process. From your twitterTester basic graph with its return node, right click, Add Node to Graph, and add your new insertTweet adaptor. Join this to the return node, move the start point.
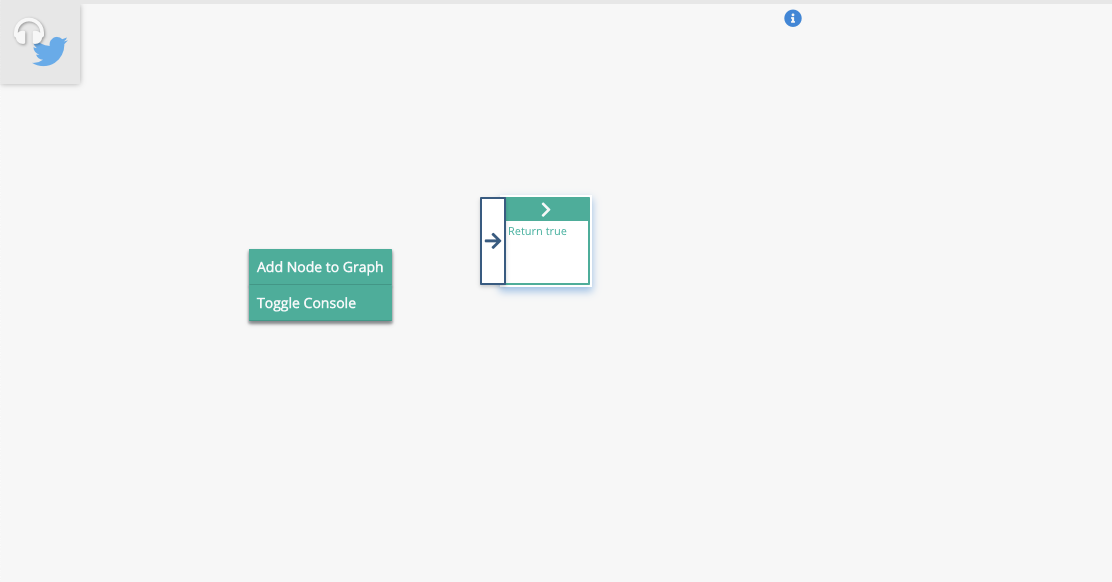
Add the node to our base graph:
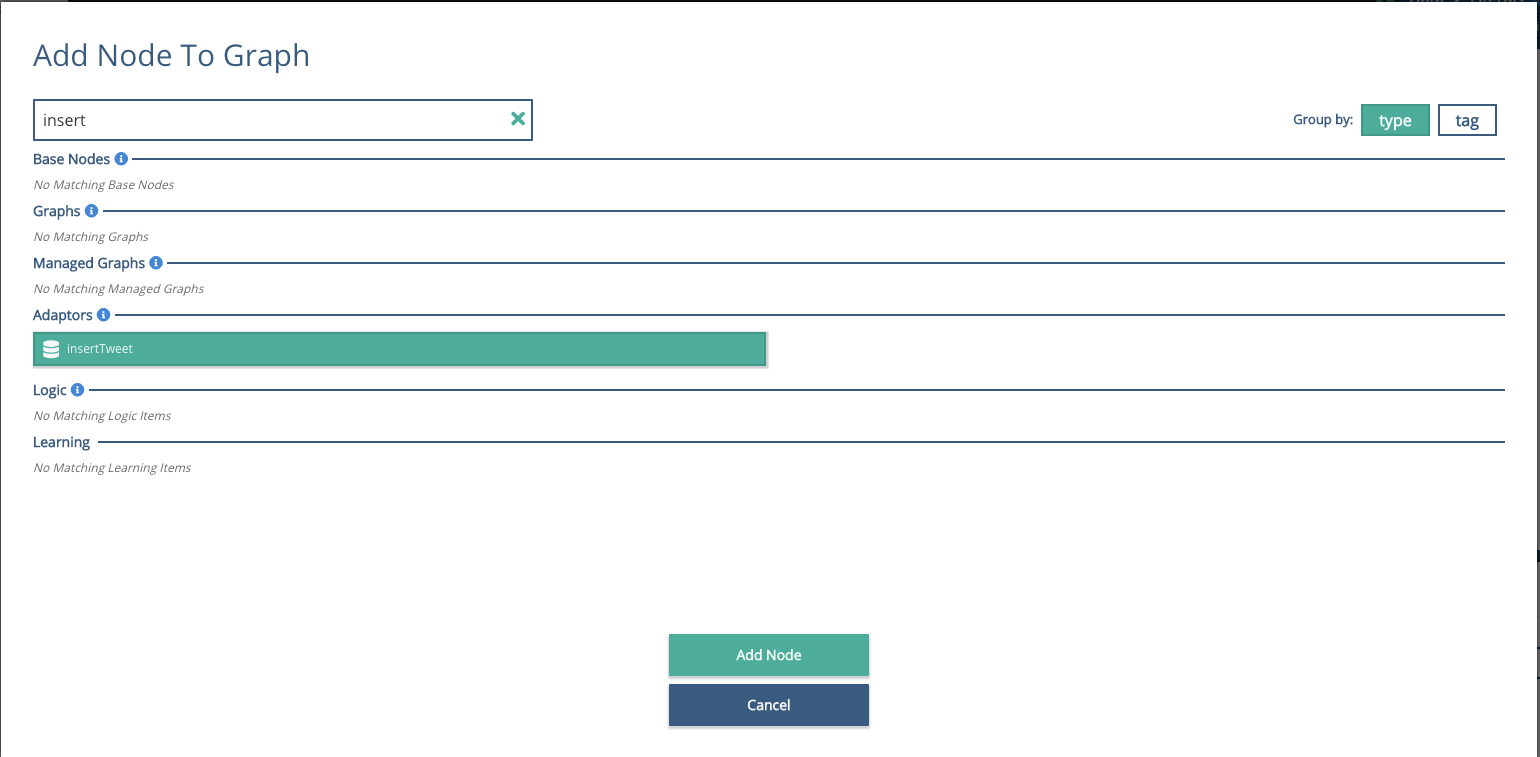
You should now see this:
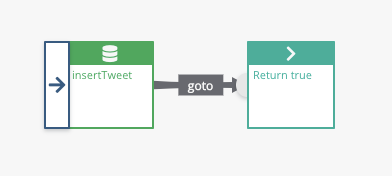
Rearrange the graphs to look like this:
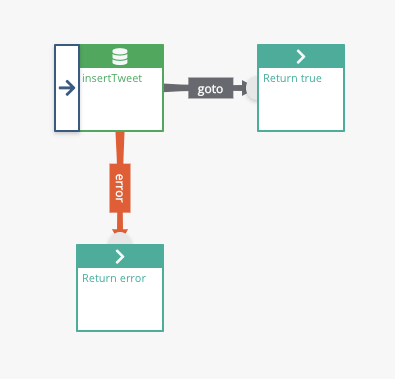
Now we are interacting with the outside world and databases, we should put in some error handling. On the insertTweet node, have an error branch, with a literal return of 'error'.
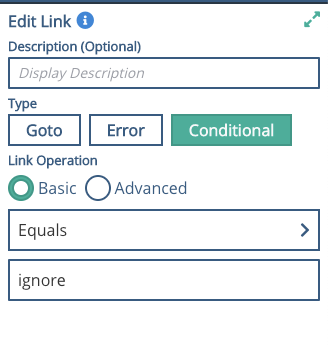
Drag out a new node, click the link, highlight it and set as Error on the "Edit Link' section in the side bar. Save changes to the link. Right click the ghost node, replace with a Return, and add a literal value of 'Error' to the slot. Alternatively, a JSON return such as {"status":"databaseFail"}
Test this with 10 iterations, and you should see the tweets going through the process and into the database. You can check this with MySQL Workbench, and start to run counts for the various cat or dog tweets.
So that gives a very basic listener, that inserts elements of the tweets into a database.
To improve the process, add some decisioning.
Step 6 - Processing the Tweets
04 Decisioning
To make the process more intelligent, we can add some decisioning.
Various types of decision node exist - as you can see form the presentation slides. For this example we will first use a Decision Tree.
Create a new decision tree, to determine english language tweets, and create a basic classification of influencers.
Create new, Decision Tree. Give it a name e.g. Twitter Segmentation.
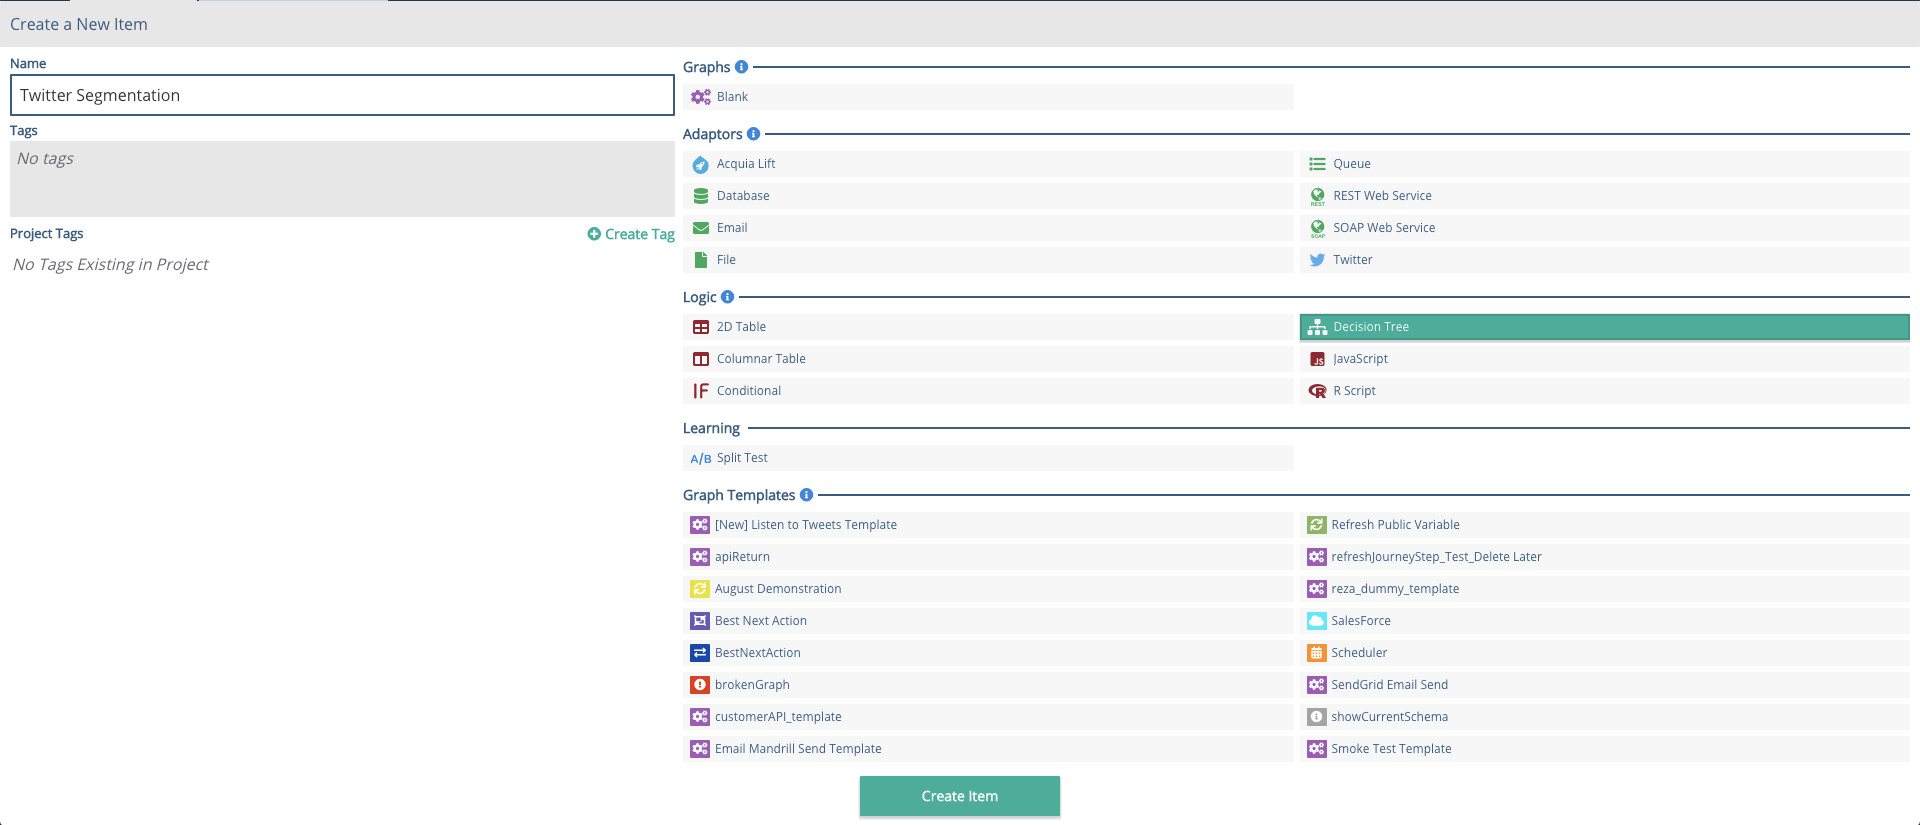
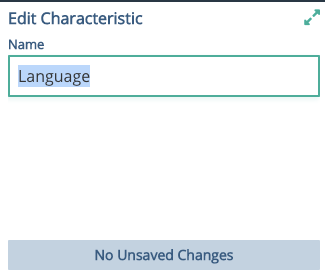
Click on the Characteristic 1 header, and change the name to Language on the side bar. Save this.
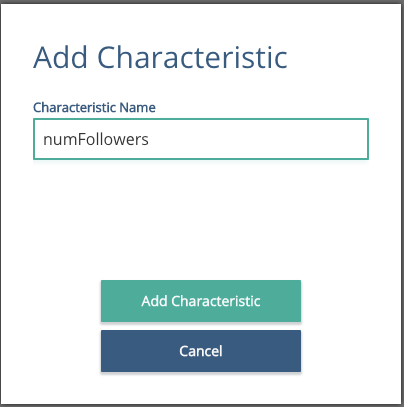
Click the  and add a second characteristic - Number of Followers. Add another called Number Following.
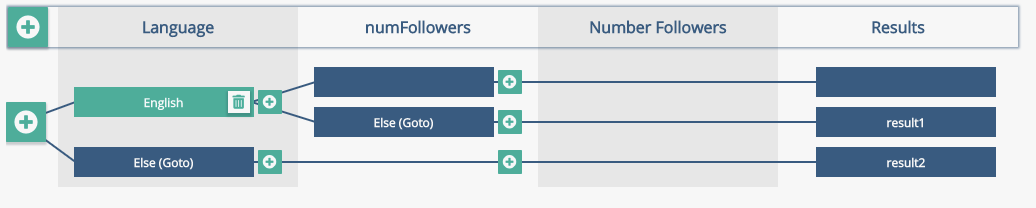
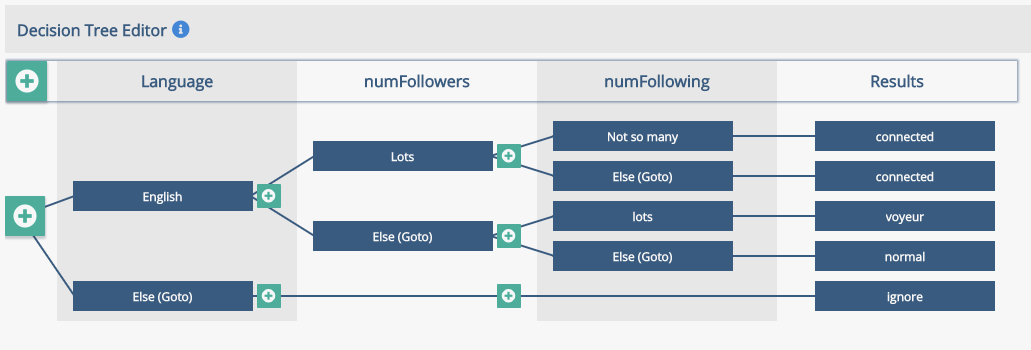
Click to add a branch to the Number of Followers, then expand the new branch for number following to reflect the picture below.
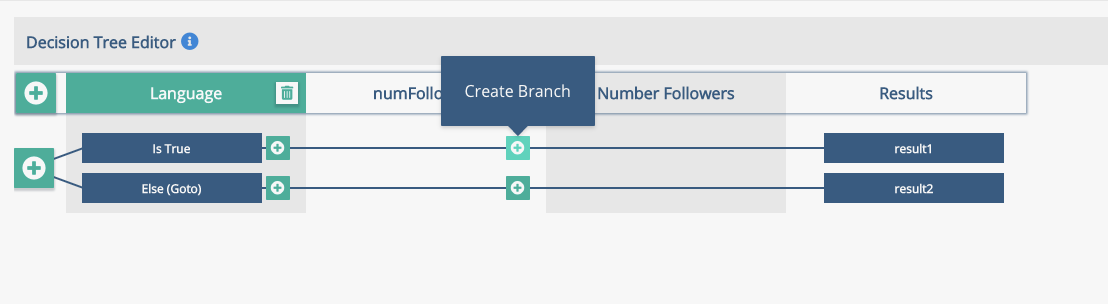
Put the focus in the new boxes, then add a description and a condition to each. Remember that you might need to use the scroll bar in the Edit Rule section if you can't see the conditions to add!
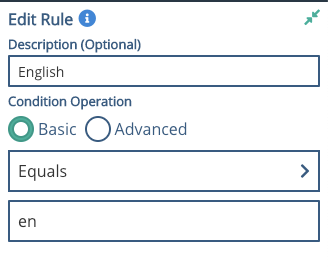
Language = en
Num Followers > 1000, Else
Number following < 100, Else, > 100, Else
Suggested results to pass on are
broadcaster, connected, voyeur, normal, ignore
This should validate OKAY.
Depending on how you are running this, either as a group cats and dogs, or individually using both, you can add this into your graph now.
Right click, add Node to Graph, select your Twitter Segmentation node, and add it in.
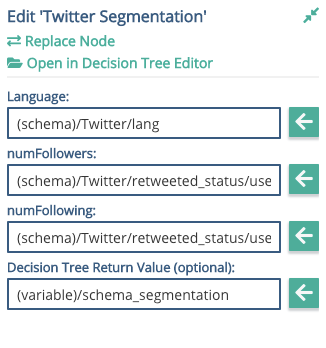
Now the Twitter Segmenter is in place, you can add the attributes to it. From the schema, find /tweet/language and out it in the Language slot.
tweet/user/followers_count into the numFollowers slot, and
tweet/user/friends_count to the numFollowing slot.
You will need to add a schema element to hold the segment return value if you want to use it. From the top of the schema, or wherever you would like to put it, create a new child called 'twitterSegment' and then add this into the slot.
This will allow the graph to validate.
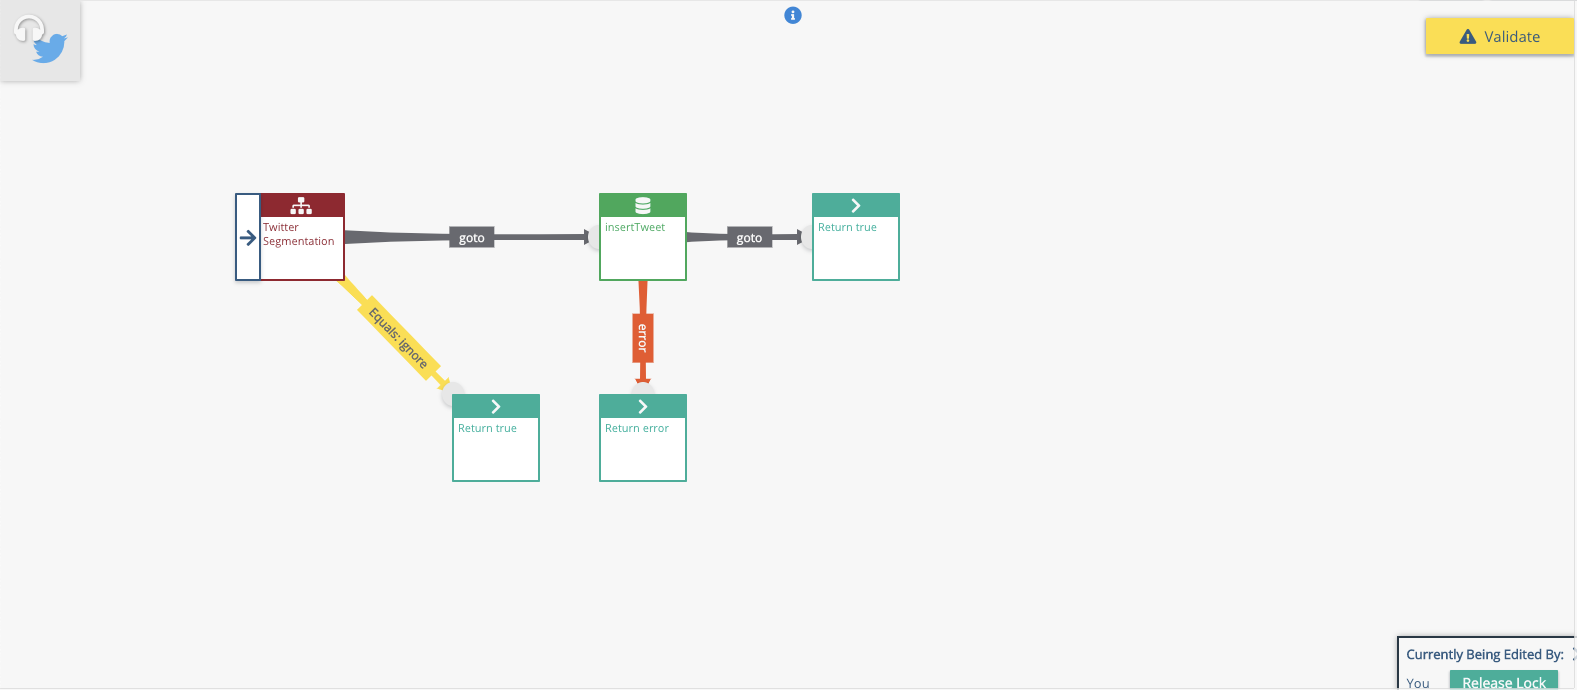
Move the start icon to this node, put a goto to the insert tweet node. Drag out a second node, set the link to be a conditional, equal to ignore, and add a return node with a literal value of 'ignore' for example.
Your graph should look similar to this:
Now we have a graph that evaluates tweets, selects english ones that meet the criteria, and loads them into a DB, whilst creating a segmentation that is held in the schema. You can of course add the segment to the database load if you want.
Double click on the insertTweet node, and alter the INSERT statement to include a new database field and a new variable. Use something like 'filter_level' which is a field in the chan_tweet table that we can use. Add a new parameter into the values, such as %%segment%% then save.
INSERT INTO chan_tweet (tweet_id, tweet_text, user_screen_name, filter_level)
VALUES ( %%tweet_id%%, %%tweet_text%%, 'Kai', %%segment%%);
In the parameters option, put the new twitterSegment into the segment slot. This should now load the new element into the database too.
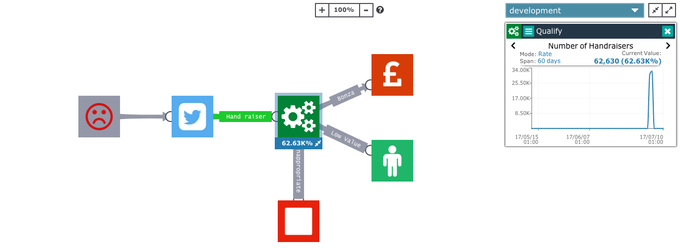
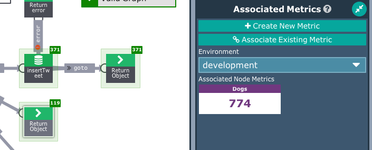
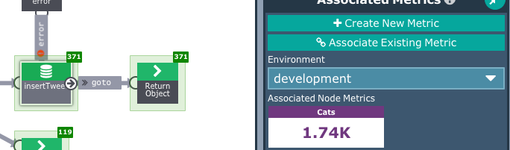
Depending on how you are running this, you can also create a single graph that has both cats and dogs in it, and creating metrics that are associated with each cat or dog. For example, something like this.
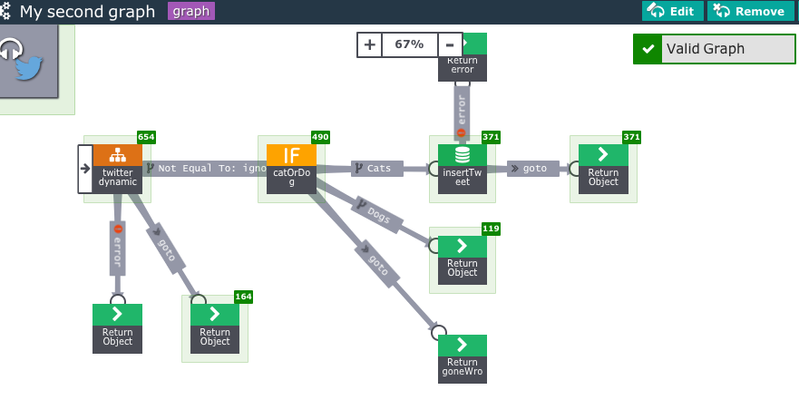
Here there is an extra few bits here, including an IF that just takes the cat tweets as 'true'. 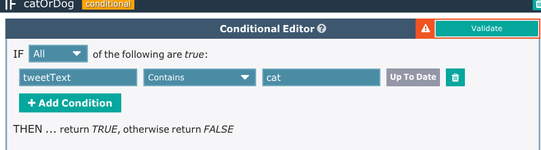
Then you can add metrics to each branch and do your own comparison.
Related content

Privacy Policy
© 2022 CSG International, Inc.