Projects
- Atul Dattatray Bhujbal
- Neil Skilling (Deactivated)
- Austin Lohr
Projects are a collection of one or more journeys, metrics and graphs. The Xponent home page shows a two column list of projects. Clicking on the name of any project will take you through to the Project Home Page.
The project page has four tabs: Overview, Journeys, Graphs and Metrics.
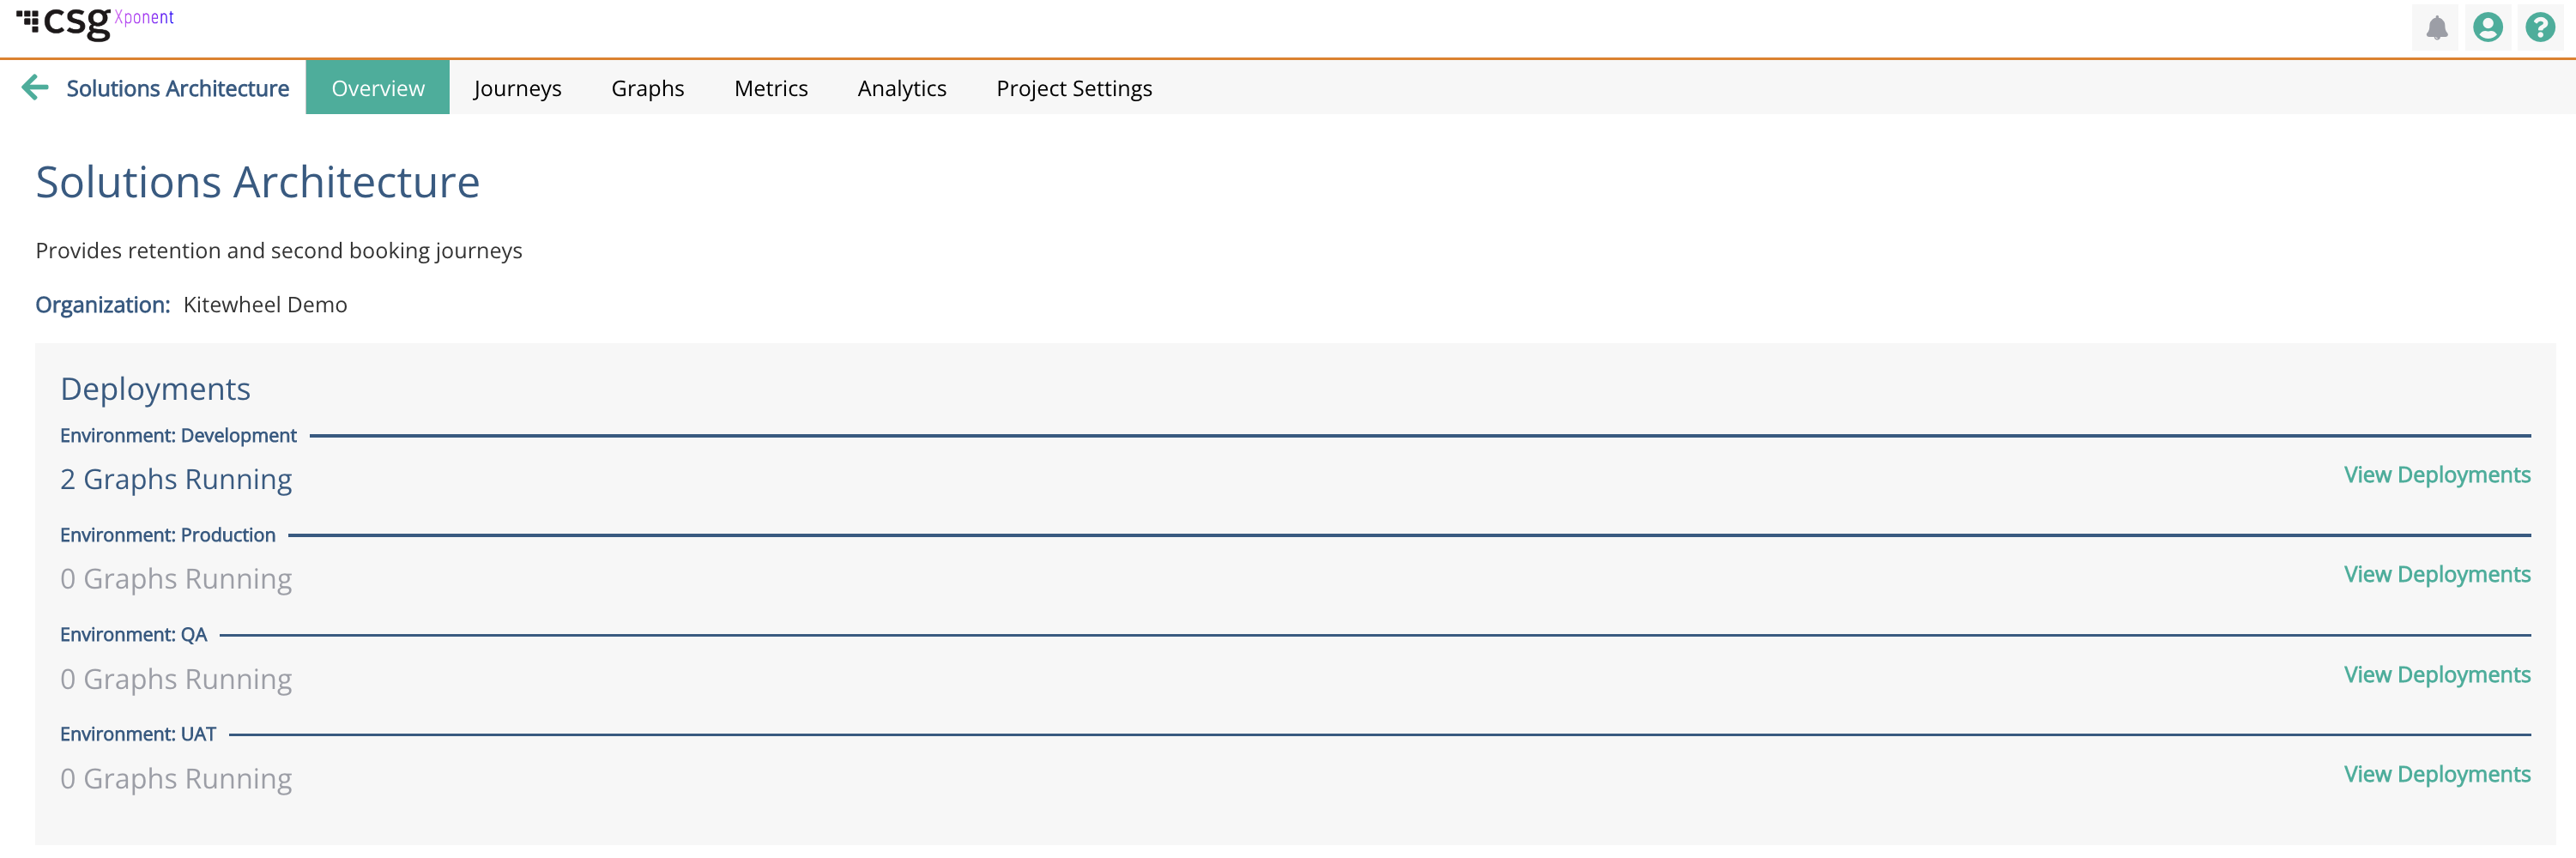
Overview Tab
The overview tab shows a summary of the project in its description and shows the deployments within each environment.
The right hand panel gives a list of shortcuts to some of the most commonly used parts of the administration page:
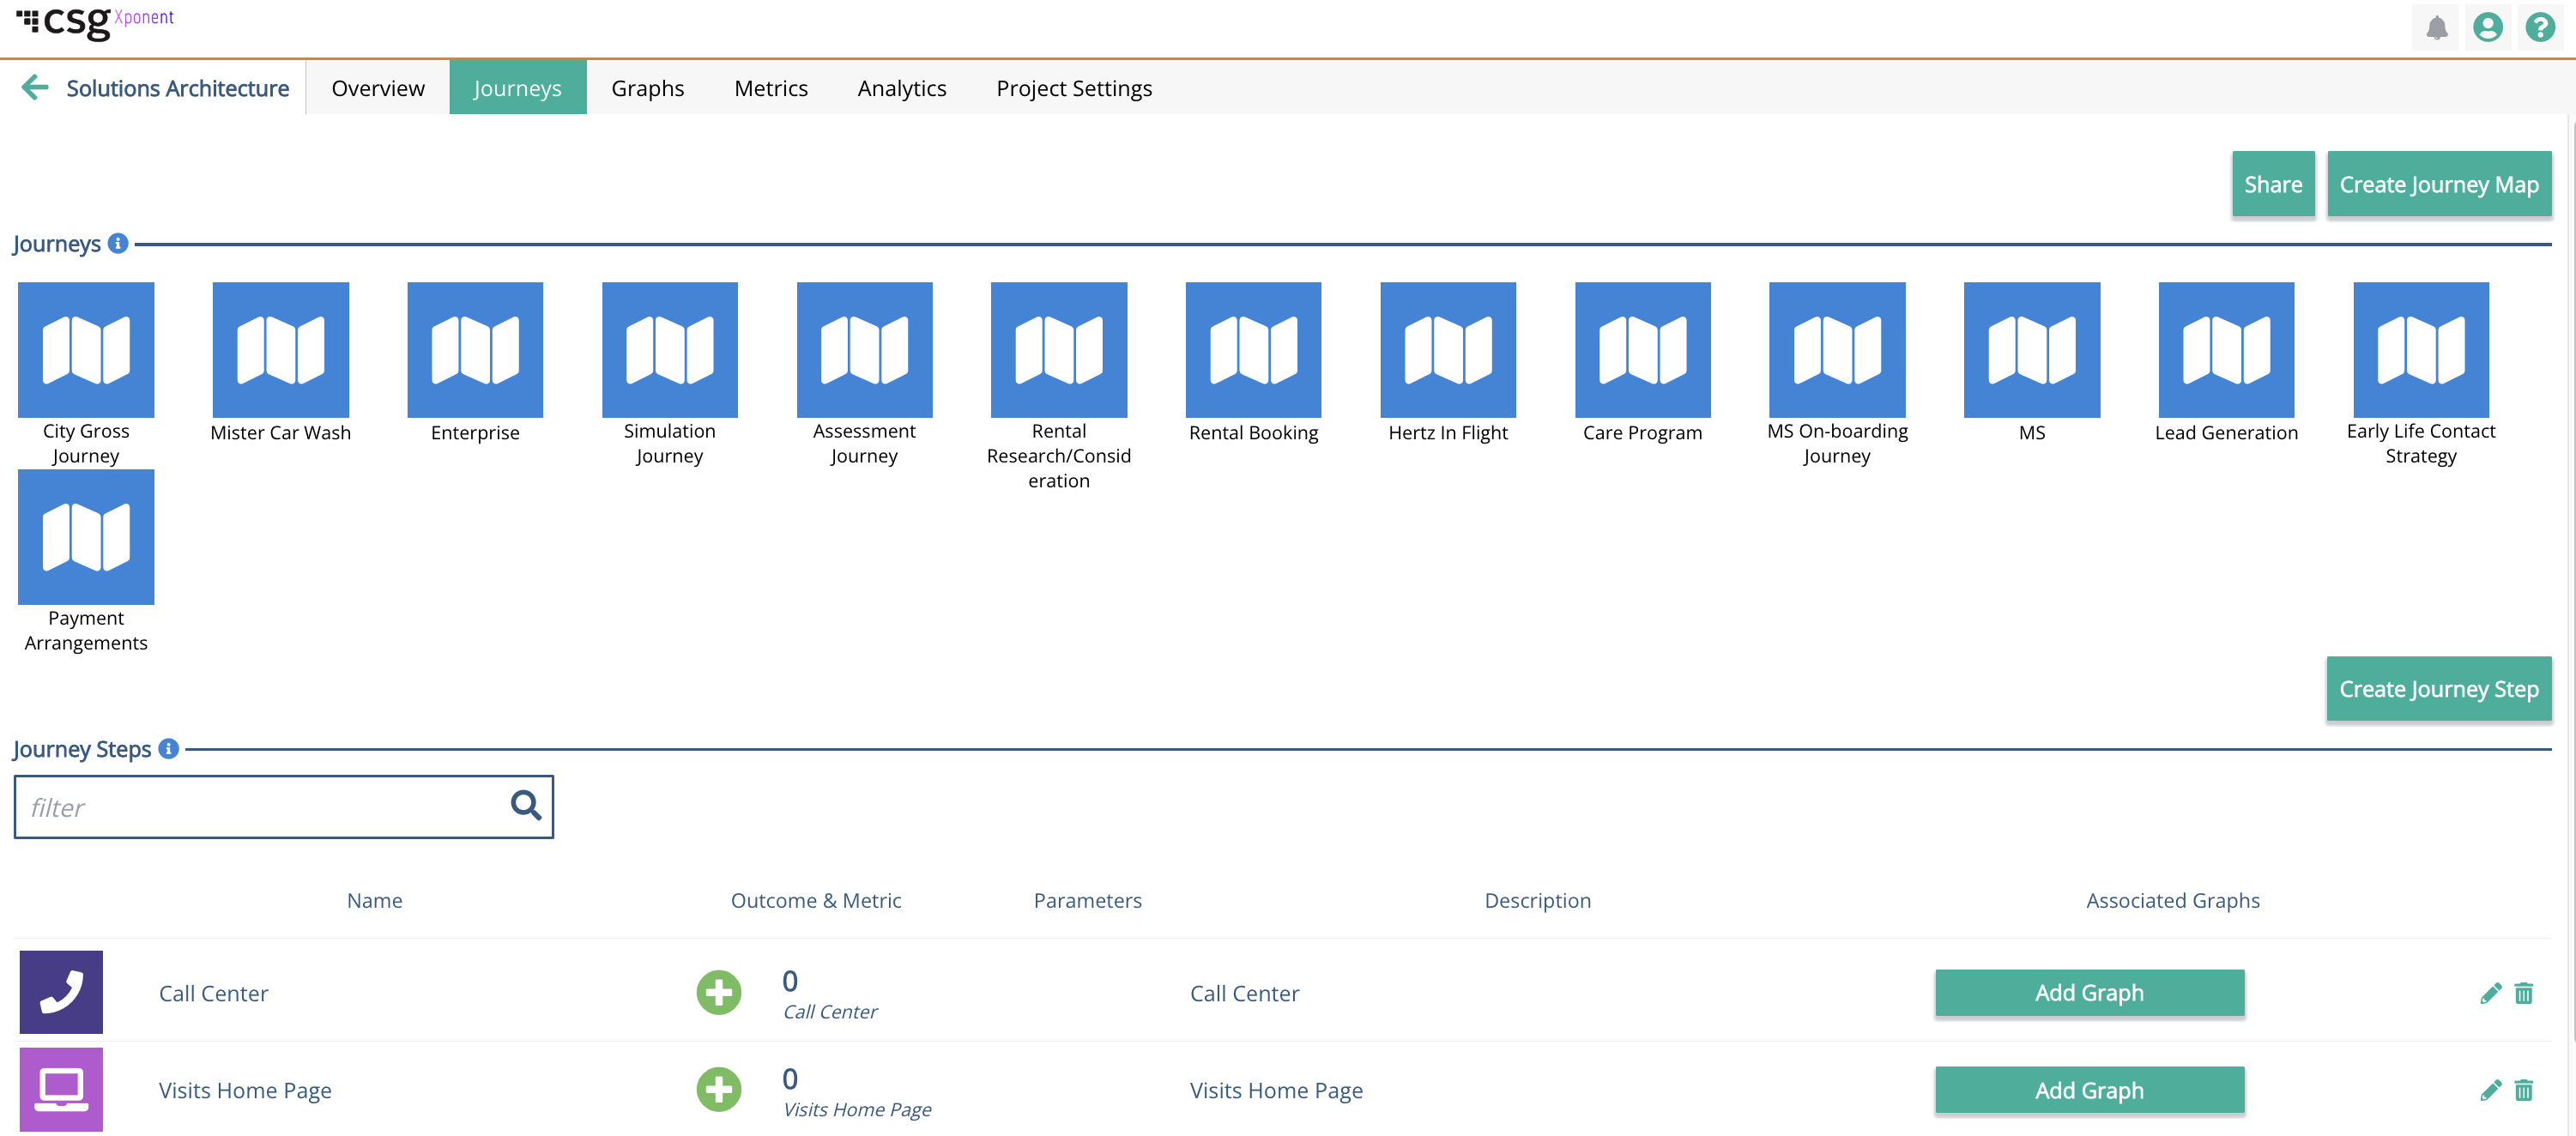
Journeys Tab
The Journeys tab shows all of the journeys in the project in a two-column layout. The filter box allows the list to be filtered by any substring of the journey name.
Graphs Tab
The Graphs tab shows all of the nodes in your project. The filter box allows the list of items to be filtered by any substring of name, tag or type of the node.
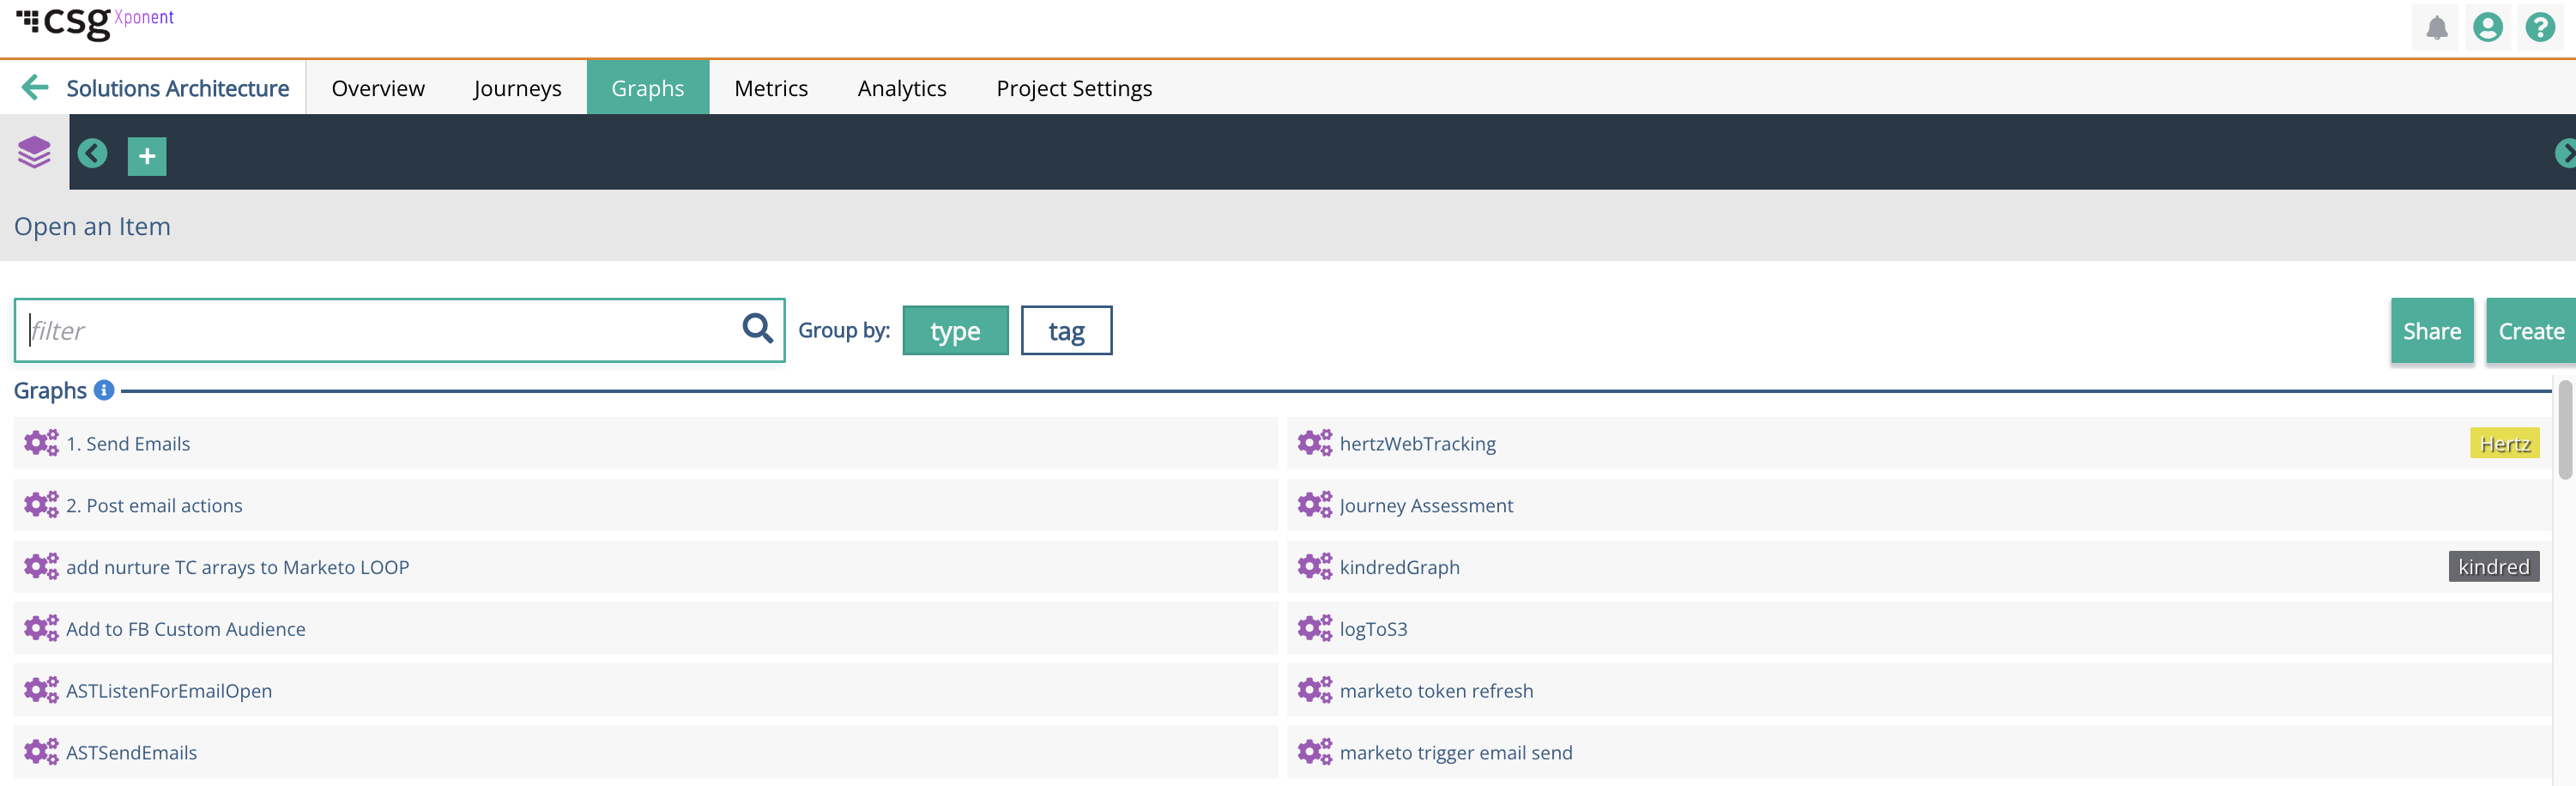
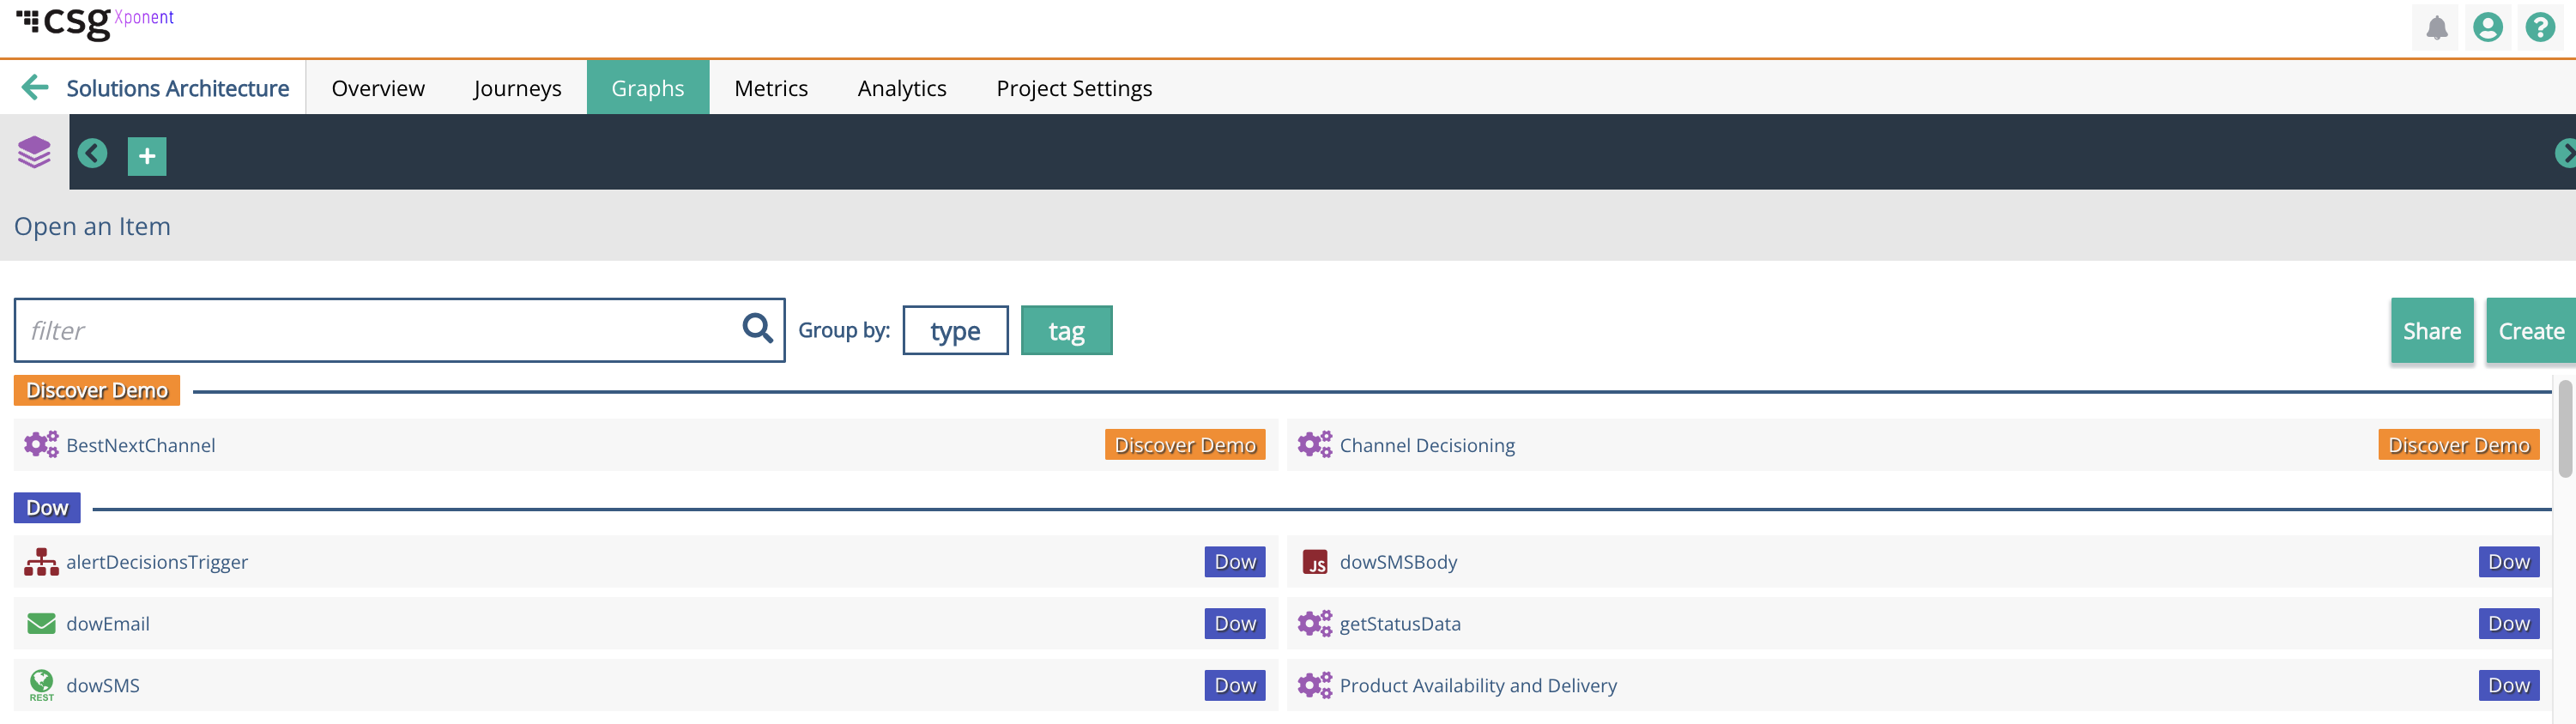
By default the graphs are grouped in a two column format into groups of graphs, adaptors, logic and learning nodes. An alternative grouping shows the user defined tags and groups the items by these tags:
The untagged items are those without a user-defined tag attached to them.
Metrics Tab
The Metrics tab shows all of the metrics defined in the project. The favorite metrics in the project, up to a maximum of six, below that all of the metrics for the project are shown in a two column layout.

The filter box supports searching the set of project metrics by any substring of their name. You can also filter by the type of metric: Basic, Compound and Default. By default the Default metrics, automatically created by Xponent, are not shown in the list. Each metric has a simple summary and shows a count, a monetary value and optionally the progression to target.
The favorite metrics can display their data using different time units and either in cumulative or rate mode.
Related content

Privacy Policy
© 2022 CSG International, Inc.