Metrics and Goals
- Atul Dattatray Bhujbal
- Neil Skilling (Deactivated)
- Austin Lohr
Metrics allow Xponent to perform closed loop journey analytics. Metrics are defined and associated with journey steps in the Journey Mapper and they are incremented by a graph when certain nodes are executed. Metrics can be created and associated with any step in the Journey Map editor or Graph. When you have associated a metric to a journey map or graph, you can also click on "Show Pinned Metrics" to display the metric count in the journey map or graph as shown below. Metrics are associated with steps in journey maps but they are updated by nodes in graphs.
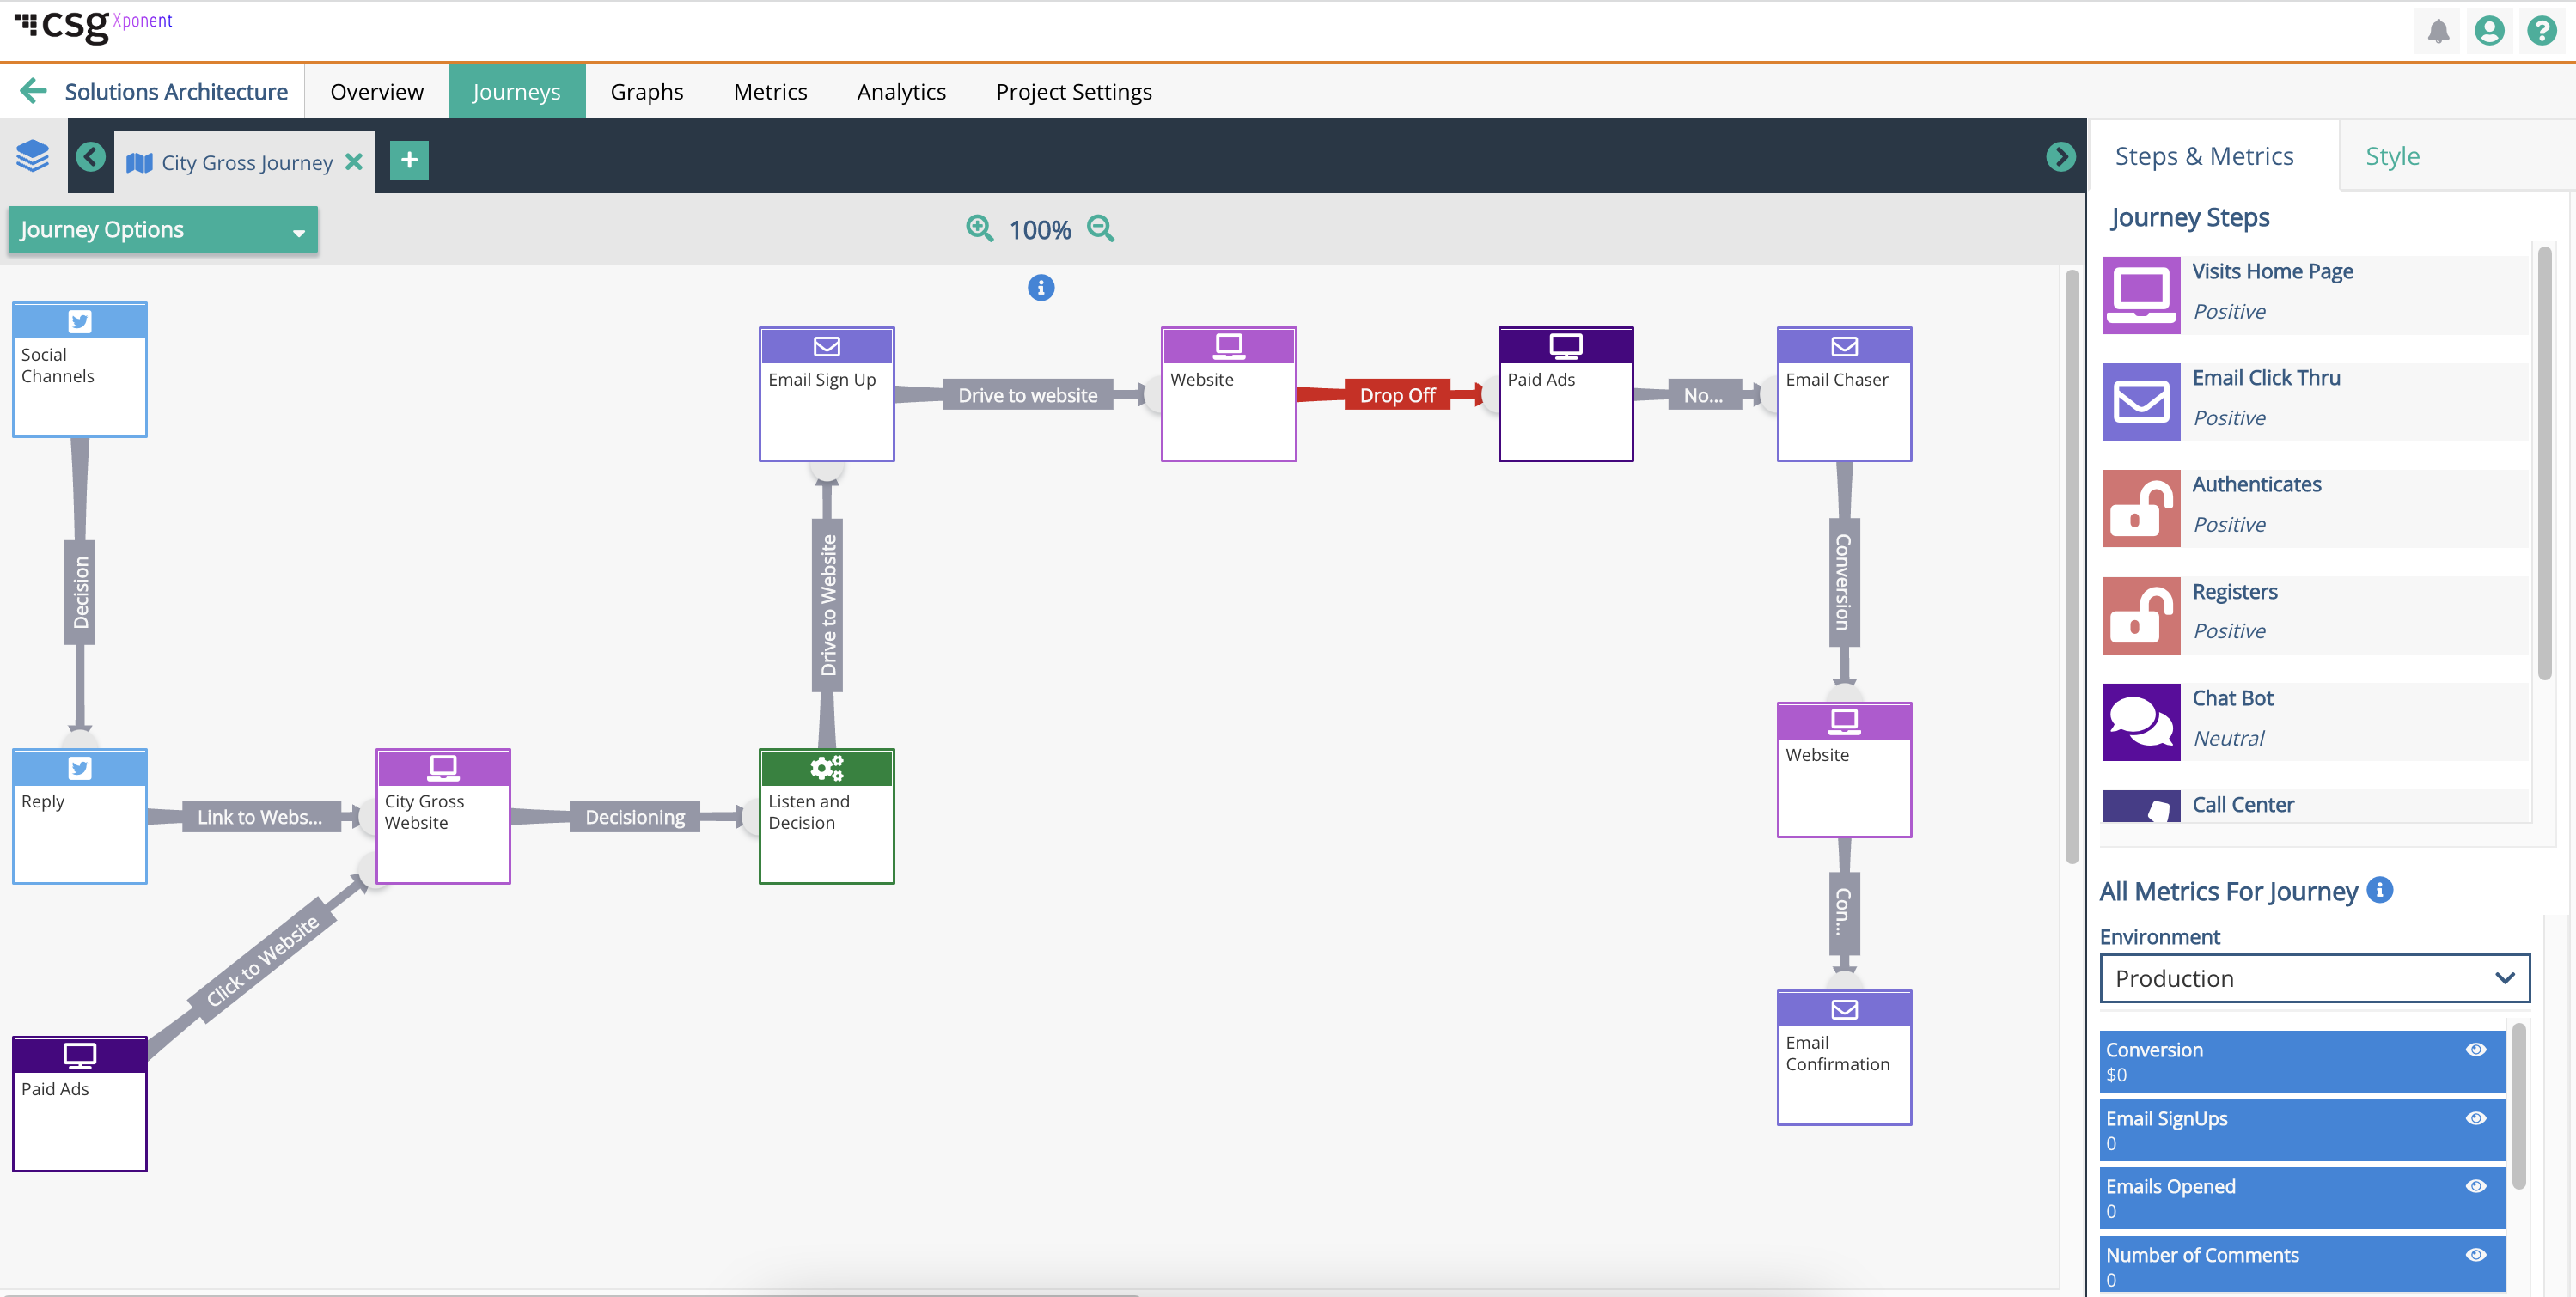
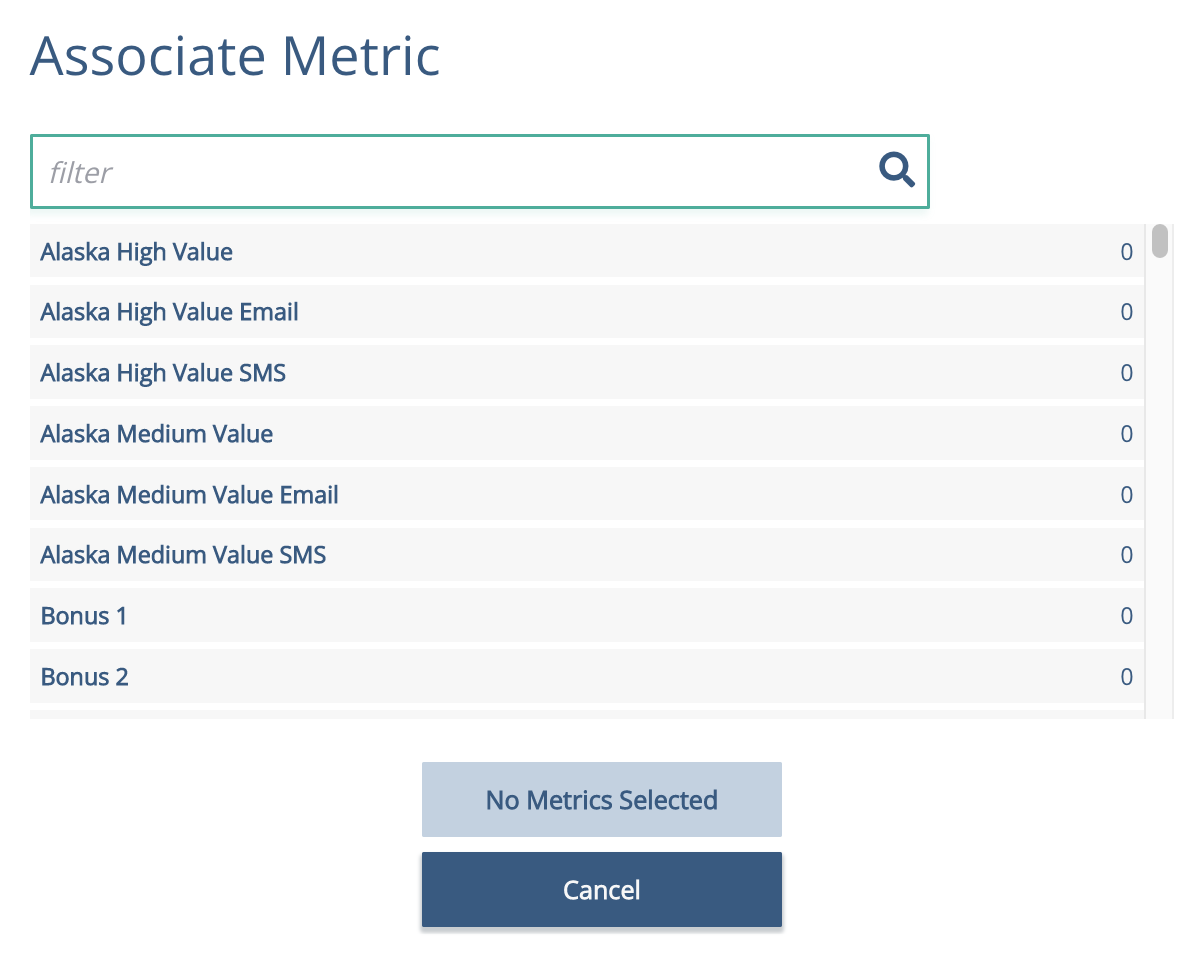
To associate the metric to a node, simply click on the node and on the right hand column, you can either create a new metric to associate with the node or associate an existing metric. Clicking on the "Associate Existing Metrics" will display the pop-up where you can select the metric you want to use. Please reference Creating Metrics and Goals as well.
Creating New Metrics
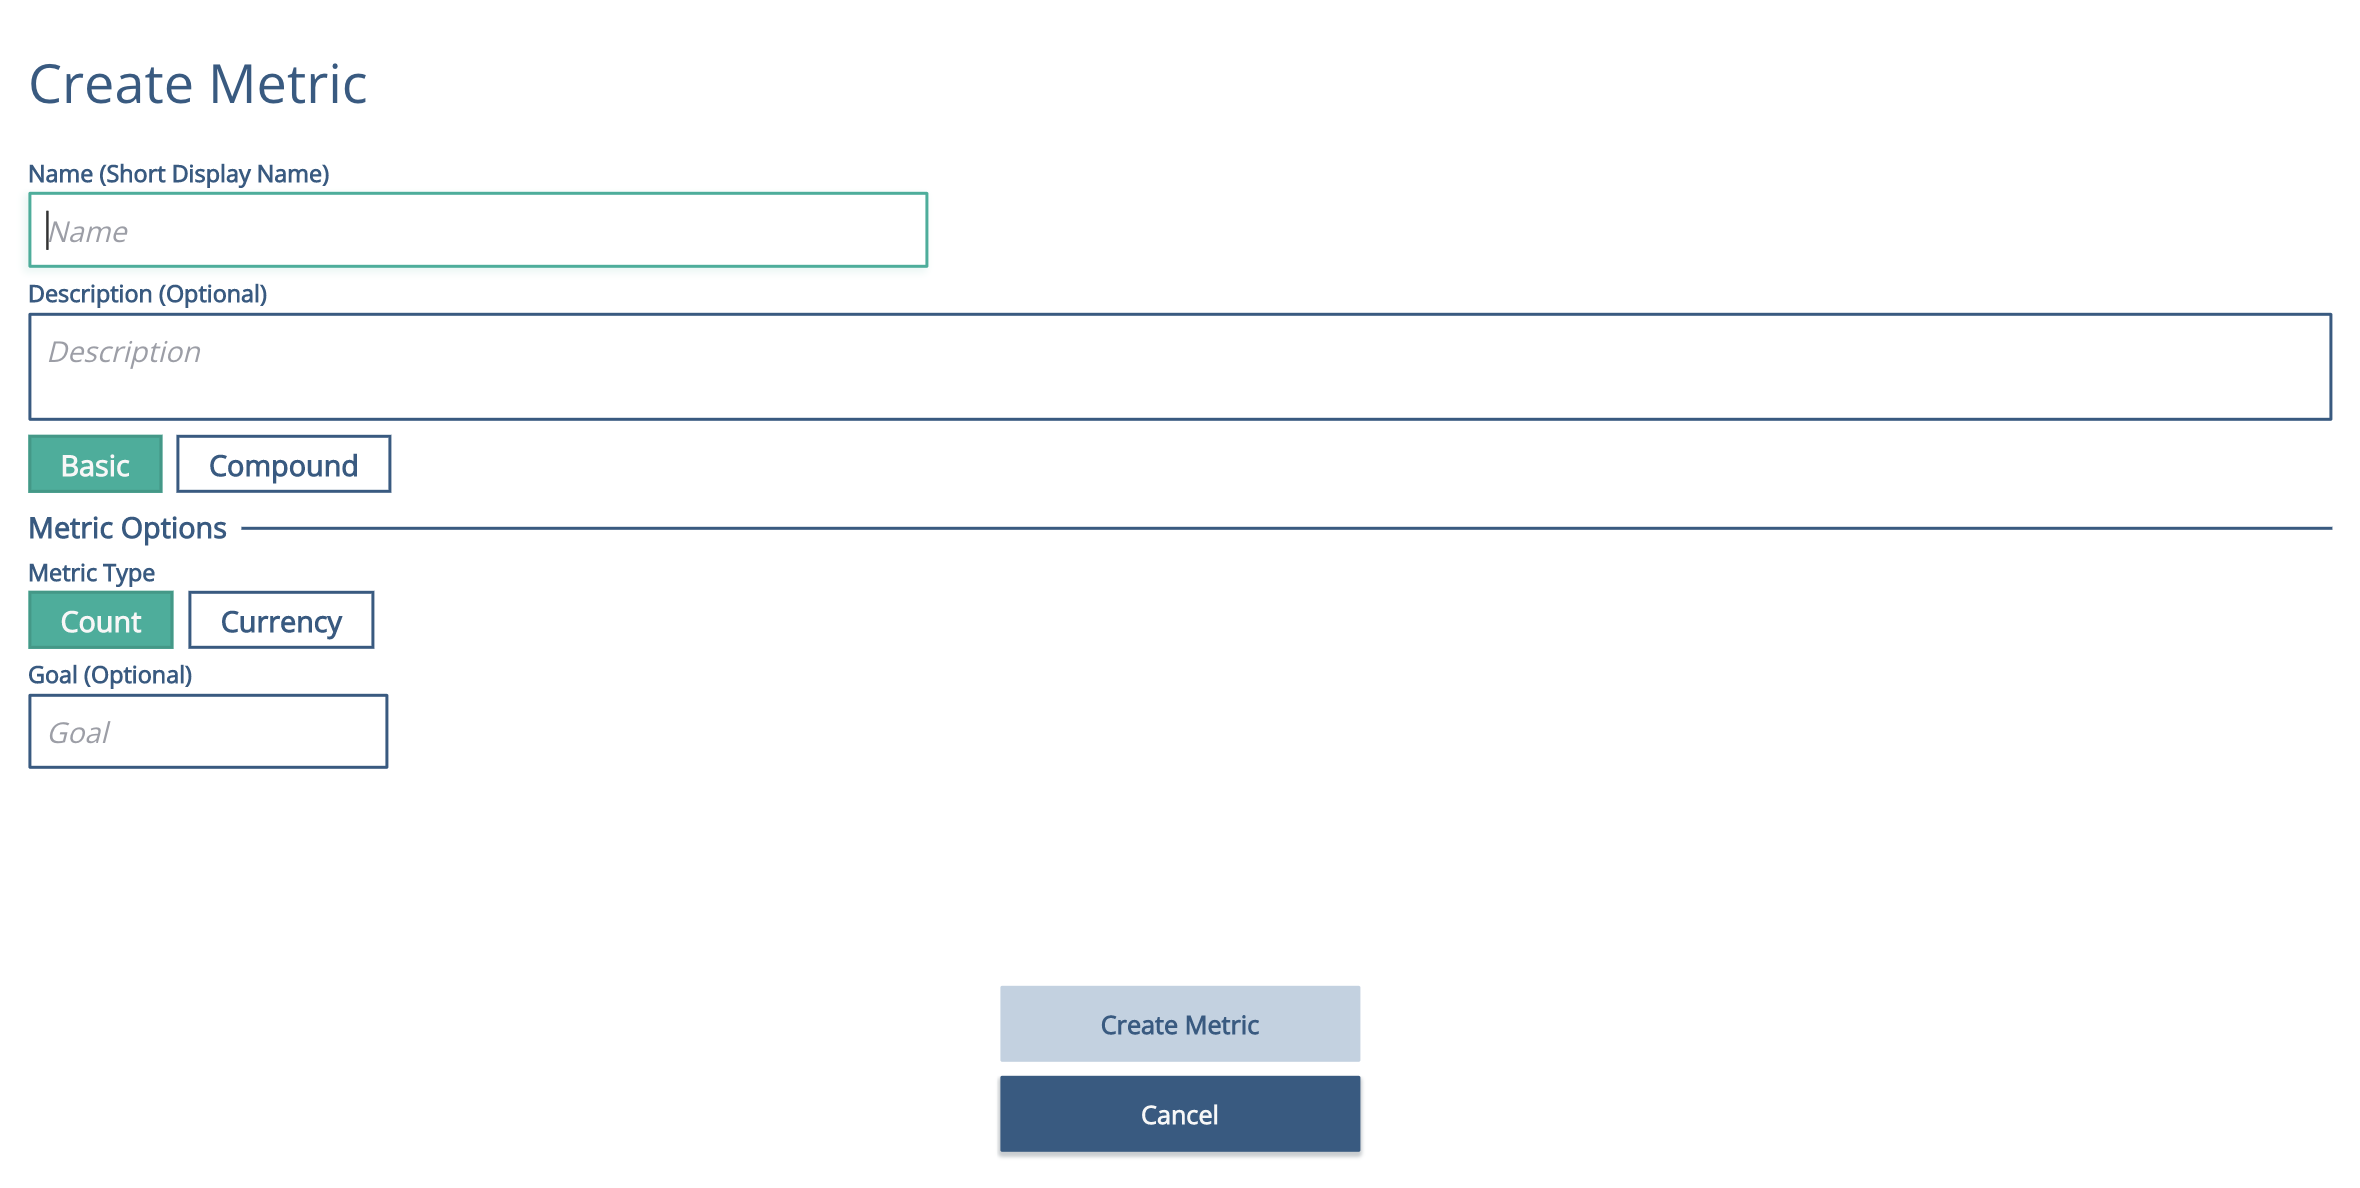
New metrics can be created by looking at the projects overview then clicking on the 'View All Metrics' button then by clicking on the '+ Create New Metric' button and this will show the Create Metric dialog window. Today, we support the creation of two types of metrics: basic metrics and compound metrics. A basic metric is a simple tally that increases by one each time a specific node in a graph has been run or a deployable graph has started and ended. A compound metric will calculate a percentage, ratio, or rate between two metrics, usually between a numerator and a denominator.
Types of Metrics
Default Metrics
Each metric has a name, a type, an optional goal and description. Default metrics are automatically made for you out of the box. Whenever a graph is deployed Xponent automatically creates two metrics for that graph, which record the starts and successful completions of the graph. These metrics are useful for finding the number of times that a graph has been run, how many ran successfully, and how many incurred an error.
Basic Metrics
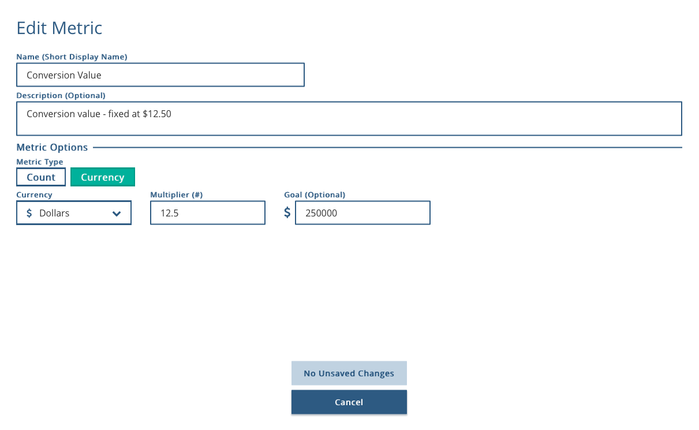
Basic Metrics are metrics that you define in the graph can be of two types: Numeric or Monetary. Monetary metrics allow the selection of the currency and the increment value. Currently supported currency values are Dollar($), Pound(£), Euro(€), and Yen (¥).

Compound Metrics
Compound metrics uses a qualified metric (left side) and a total metric (right side) to support four types of methods for calculations: percentage, rate, weighted index, or advanced.
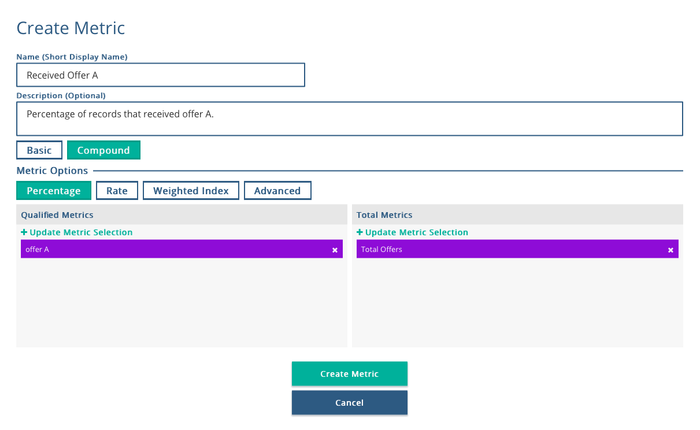
With the exception of the percentage method, the outputs of all methods will result in a decimal that ranges from 0.0 to 1.0, while the percentage method will return a value between 0% to 100%. The four methods for calculating compound metrics are further explained below:
| Method | Formula | Example |
|---|---|---|
| Percentage | Qualified Metrics divided by Total Metrics | Calculating the percentage of customers that received Offer A (QM) out of all possible offers (TM). QM / TM = X% |
| Rate | Qualified Metrics divided by Total Metrics | Calculating the rate at which customers received Offer A (QM) out of all possible offers (TM) QM / TM = 0.X |
| Weighted Index | Qualified Metrics multiplied by their weight and then divided by Total Metrics multiplied by their weight | Calculating the rate after assigning a weighted value to each of the metrics to evaluate price of marketing spend on customers ((QM1 * 0.3) + (QM2 * 0.4)) / (TM * 1) |
| Advanced | A freeform formula that you can use to write your own formulas that utilize basic math symbols and various basic functions such as random, max and min. For documentation, please visit: https://slack-redir.net/link?url=https%3A%2F%2Fgithub.com%2Fsilentmatt%2Fexpr-eval | |
Once a metric is created it will be shown as a small tile in the Associated Metrics list. The tile has two active areas. In the top left is the favorite metric selection star and in the bottom right is the disassociate link. Up to four favorite metrics will be displayed on the project tile on the Xponent home page. All metrics are shown via the metrics button on the project tile from the home screen.
![]()
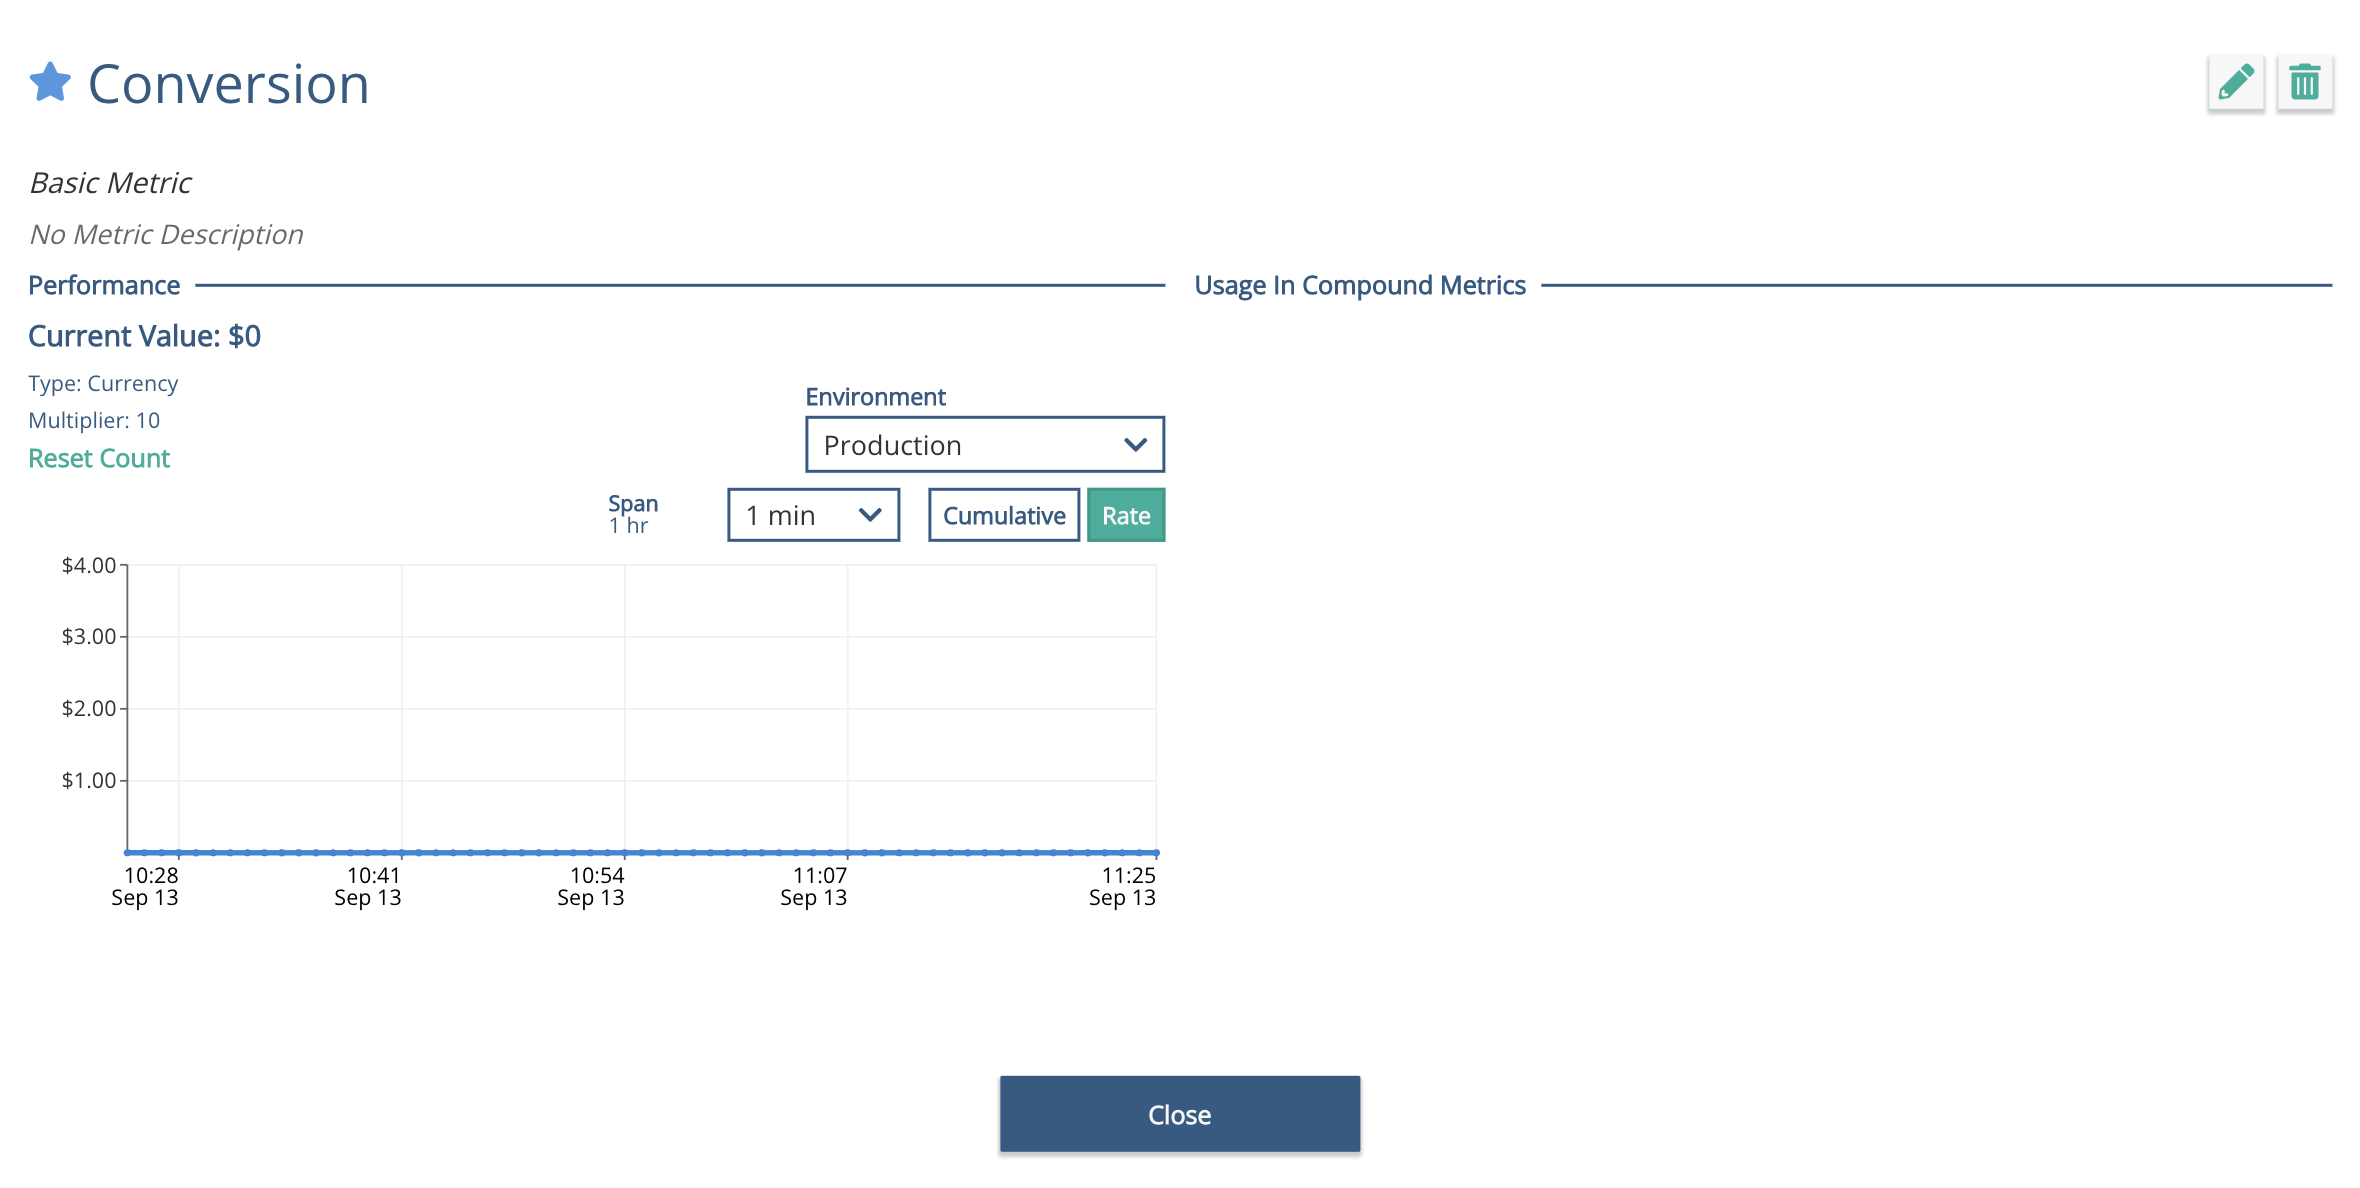
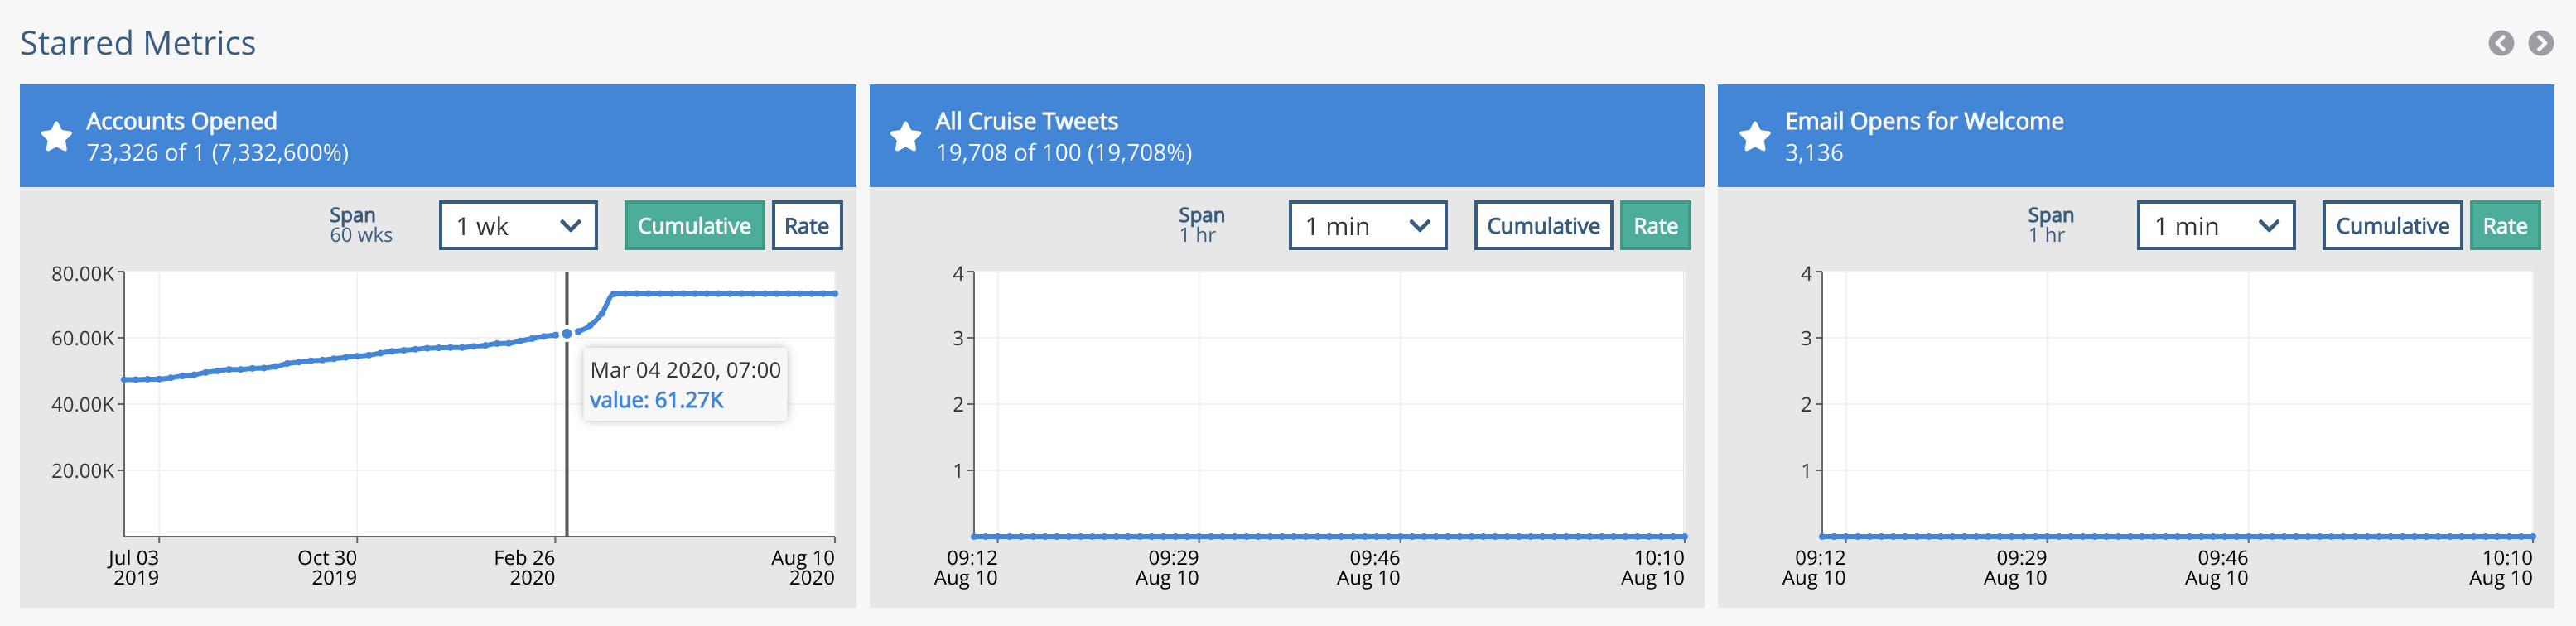
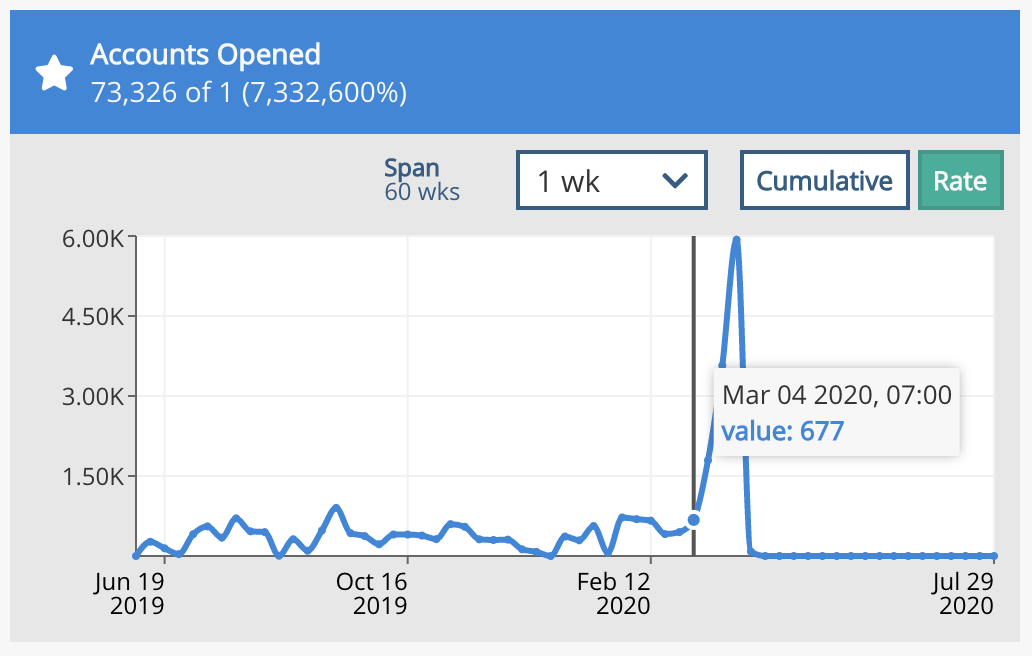
Once you have favorited a metric, you can then select to view the metric intervals from 1 week to 1 minute. Each dot on the line represents the interval span and the total count the metric has incurred by rate or cumulative button as shown below. Cumulative measures the total count of the metric throughout time whereas Rate displays the count of the metric in a specific time span. Rate requires a full completed period for calculation whereas Cumulative shows the current value. When the span selection is 1 week, the calculation is done from Thursday to Wednesday, and not Sunday to Saturday. This is because the calculation is based on UNIX timestamps starting with January 1st 1970 (which was a Thursday). The dates displayed in view are the start of the weeks, not end.
As an example of the first image below, assuming you have selected your span interval to reflect 1 week and you have selected Cumulative, then the image below is indicating that as of March 4th 2020, the total count of your Accounts Opened metric is at 61.27K since the start of your project. Whereas, if you selected Rate, then the calculation will reflect 677 count instead as 677 is the total number you are adding in that week.
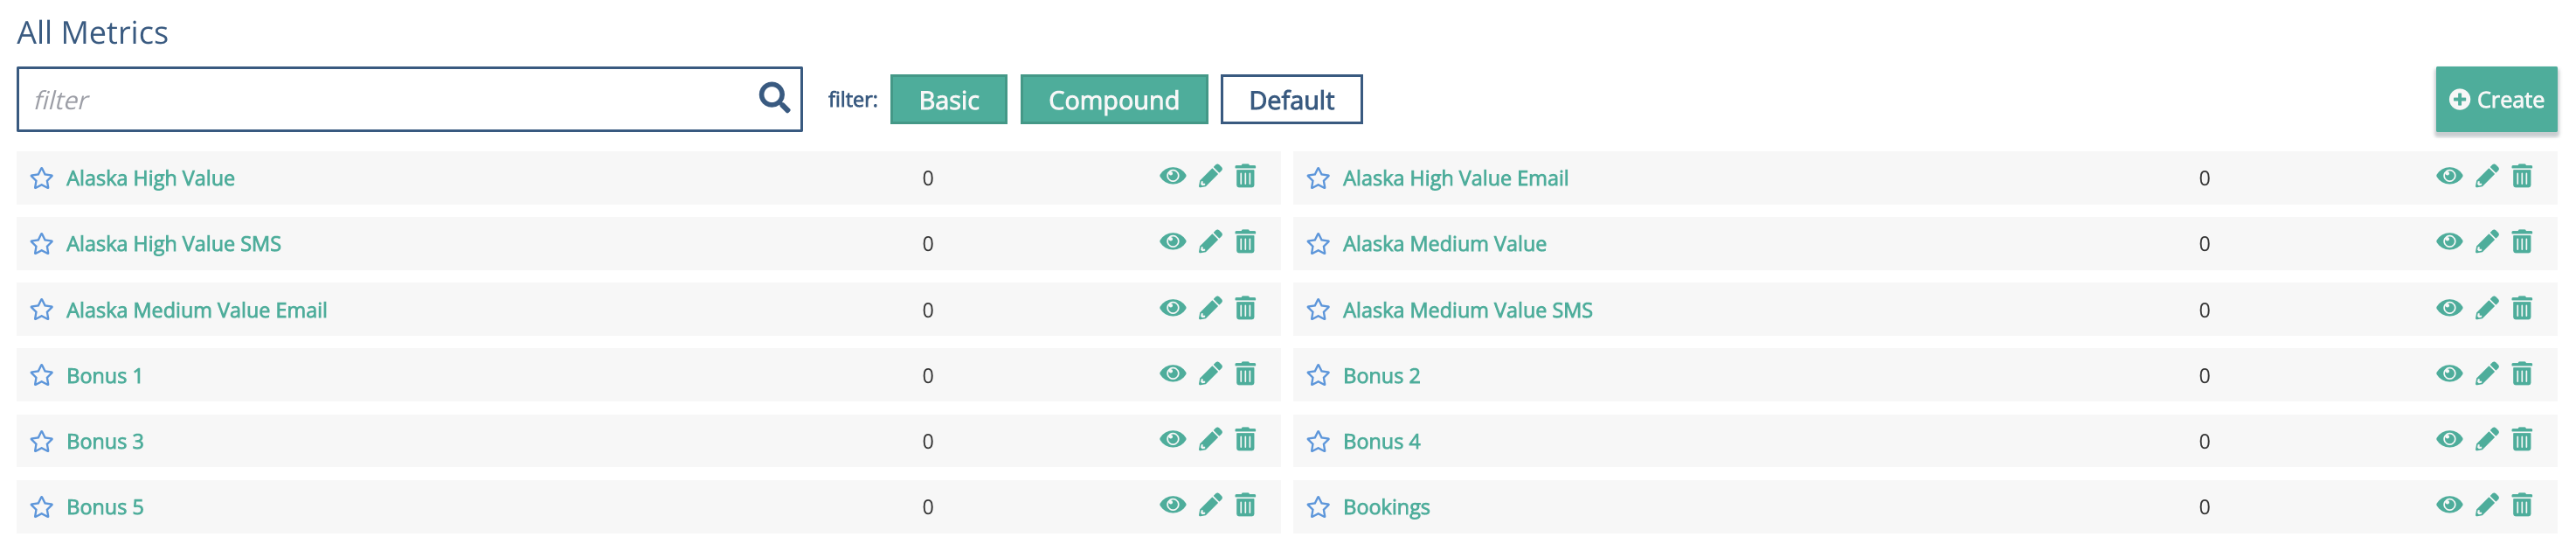
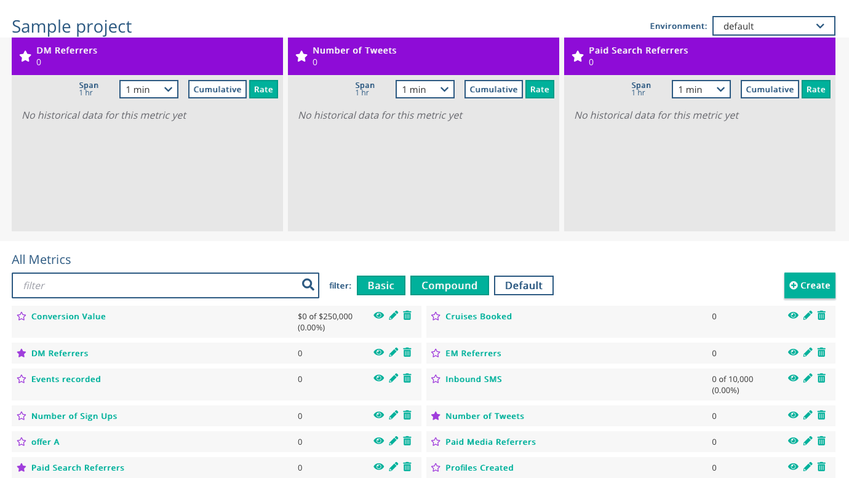
If a metric is defined with a goal then a percentage of the goal achieved will be shown and the metric tile will be colored in red, orange or green depending on the metric completion level. The screen shot below shows the Show All Metrics window from a project that has many metrics - the four favorite metrics are shown first on this window. New metrics can also be added in this window.
Editing and Deleting Metrics
Metrics can be removed or edited from the project overview screen after clicking on the view all metrics buttons.
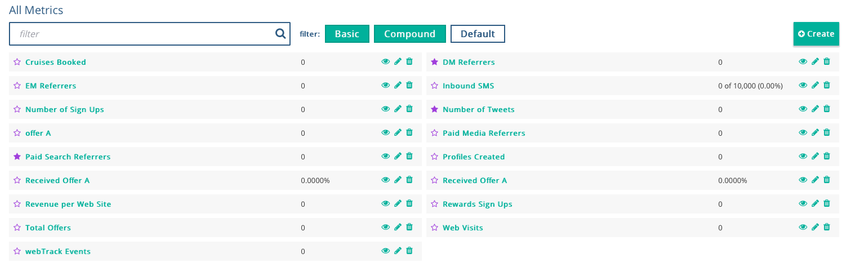
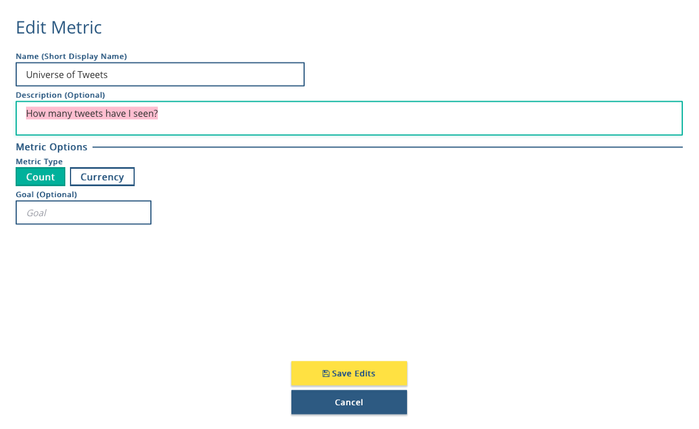
From the metrics overview for the project, double click on the metric that needs to be edited or deleted and the option to edit the details of the metric will pop up. In order to delete the metric click on the delete button in the bottom right corner of the window.

Privacy Policy
© 2022 CSG International, Inc.